Category Archives: Enterprise Software

Tableau Software Analyst Briefing: Mid-size BI success and focus on the future

Yesterday, Tableau Software held an analyst briefing. It wasn’t a high level one, it was really just a webinar where they covered some product futures under NDA. However, it was very unclear what was NDA and what wasn’t. When they discussed things announced at the most recent Tableau Conference in Seattle, that’s not NDA, but there was plenty of future discussed, so I’ll walk a fine line.

The first news is to cover their Third Quarter announcement from the beginning of the month. This was Tableau’s first quarter of over $100 million in recognized revenue. It’s a strong showing and they’re justifiable proud of their consistent growth.

Ajay Chandrdamouly, Analyst Relations, also said that the growth primarily results from a Land and Expand strategy, beginning with small jobs in departments or divisions, driven by business needs, then expanding into other organizations and eventually into a corporate IT account position. However, one interesting point is an expansion mentioned later in the presentation by Francois Ajenstat, Product Management, while giving the usual case studies seen in such presentations. He did a good job of showing one case study that was Land and Expand, but another began as a corporate IT account and usage was driven outward by that. It’s an indication of the maturity of both Tableau and the business intelligence (BI) market that more and more BI initiatives are being driven by IT at the start.

Francois’ main presentation was about releases, past and future. While I can’t write about the later, I’ll mention one concern based on the former. He was very proud about the large number of frequent updates Tableau has released. That’s ok in the Cloud, where releases are quickly rolled into the product that everyone uses. However, that’s a risk in on-premises (yes, Francois, the final S is needed) installations in the area of support. How long do you support products and how do you support them is an issue. Your support team has to know a large number of variations to provide quick results or must investigate and study each time, slowing responses and possibly angering customers. I asked about the product lifecycle and how they managed to support and to decide sunsetting issues, but I did not get a clear and useful answer.

The presentation Mr. Ajenstat gave listed six major focus themes for Tableau, and that’s worth mentioning here:

  • Seamless Access to Data
  • Analytics & Statistics for Everyone
  • Visual Analytics Everywhere
  • Storytelling
  • Enterprise
  • Fast, Easy, Beautiful

None of those is a surprise, nor is the fact that they’re trying to build a consistent whole from the combination of foci. The fun was the NDA preview of how they’re working on all of those in the next release. One bit of foreshadowing, they are looking at some issues that won’t minimize enterprise products but will be aimed at a non-enterprise audience. They’ll have to be careful how they balance the two but expansion done right brings a wider audience so can be a good thing.

The final presenter was Ellie Fields, Product Marketing, who talked more about solution than product. Tableau Drive is not something to do with storage or big data, it’s a poorly named but well thought out methodology for BI projects. Industry firms are finally admitting they need some consistency in implementation and so are providing best practices to their implementation partners and customers to improve success rates, speed implementation and save costs. Modern software is complex, as are business issues, so BI firms have to provide a combination of products and services that help in the real world. Tableau Drive is a new attempt by the company to do just that. There’s also no surprise that it uses the word agile, since that’s the current buzzword for iterative development that’s been going on long before the word was applied. As I’m not one who’s implemented BI product, I won’t speak to its effectiveness, but Drive is a necessity in the marketplace and Tableau Drive helps provide a complete solution.

Summary

The briefing was a technical analyst presentation by Tableau about the current state of the company and some of its futures. There was nothing special, no stunning revelations, but that’s not a problem. The team’s message is that the company has been growing steadily and well and that their plans for the future are set forward to continue that growth. They are now a mid-size company, no longer as nimble as startups yet don’t have the weight of the really large firms, they have to chart a careful path to continue their success. So far it seems they are doing so.
Magnitude/Kalido Webinar Review: Automated and Agile, New Principles for Data Warehousing

I watched a webinar yesterday. It was sponsored by Magnitude, the company that is the result of combining Kalido and Noetix. The speakers were Ralph Hughes, a data warehousing consultant operating as Ceregenics, and John Evans of Magnitude.

Ralph Hughes’ portion of the presentation was very interesting in a great way. Rather than talking about the generalities of enterprise data warehouses (EDW) and Agile, he was the rare presenter who discussed things clearly and in enough detail for coherent thought. It was refreshing to hear more than the usually tap dance.

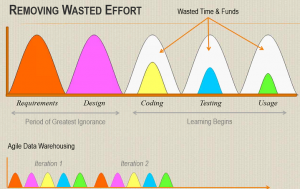
Webinar - Magnitude - Ceregenics slide

Ralph’s slide on the advantages of agile development for EDW’s is simple and clear. The point is that you don’t know everything when you first acquire requirements and then design a system. In the waterfall approach, much of coding, testing and usage is wasted time as you find out you need to do extra work for new requirements that pop up. Agile allows business users to quickly see concepts and rethink their approaches, saving both time to some productivity and overall time and effort of development.

After talking about agile for a bit, he pointed out that it does save some time but still leaves lots of basic work to do. He then shifted to discuss Kalido as a way to automate some of the EDW development tasks in order to save even more time. He used more of his presentation to describe how he’s used the tool at clients to speed up creation of data warehouses.

One thing he did better in voice than on slides was to point out that automation in EDW doesn’t mean replacing IT staff. Rather, appropriately used, it allows developers to move past the repetitive tasks and focus on working with the business users to ensure that key data is encapsulated into the EDW so business intelligence can be done. Another key area he said automation can’t do well is to manage derived tables. That still requires developers to extract information, create the processes for creating the tables, then moving the tables back into the EDW to, again, enhance BI.

Notice that while Mr. Hughes spoke to the specifics of creating EDWs, he always presented them in context of getting information out. Many technical folks spend too much time focused on what it takes to build the EDW, not why it’s being build. His reminders were again key.

John Evans’ presentation was brief, as I always like to see from the vendors, rounding out what his guest speaker said. He had three main points.

First, the three main issues facing IT in the market are: Time to value, time to respond to change and total cost of ownership. No surprise, he discussed how Magnitude can address those.

Second, within his architecture slide, he focused on metadata and what he said was strong support for master data and metadata management. Given the brief time allotted, it was allusion to the strengths, but the fact that he spoke to it was a good statement of the company’s interests.

Third, he discussed the typical customer stories and how much time the products saved.

Summary

The webinar was very good exposure to concepts for an audience thinking about how to move forward in data warehousing, whether to build EDWs or maintain them. How agile development and an automation tool can help IT better focus on business issues and more quickly provide business benefit was a story told well.

Revolution Analytics at BBBT: Vision and products for R need to mesh

Revolution Analytics presented to the BBBT last Friday. The company is focused on R with a stated corporate vision of “R: The De-facto standard for enterprise predictive analytics .” Bill Jacobs, VP, Product Marketing, did most of the talking while Steve Belcher, Sales Engineer, gave a presentation.

For those of you unfamiliar with R as anything other than a letter smack between Q and S, R is an open source programming language for statistics and analytics. The Wikipedia article on R points out it’s a combination of Scheme and S. As someone who programmed in Scheme many years ago, the code fragments I saw didn’t look like it but I did smile at the evolution. At the same time, the first thing I said when I saw Revolution’s interactive development environment (IDE) was that it reminded me of EMACS, only slightly more advanced in thirty years. The same wiki page referenced earlier also said that R is a GNU project, so now I know why.

Bill Jacobs was yet another vendor presenter who has mentioned his company realized that the growth of the Internet of Things (IOT) means a data explosion that leaves what is currently misnamed as big data in the dust as far as data volumes. He says Revolution wants to ensure that companies are able to effectively analyze IOT and other information and that his company’s R is the way to do so.

Revolution Analytics is following in the footsteps of many companies which have commercialized freeware over the years, including Sun with Unix and Red Hat with Linux. Open source software has some advantages, but corporate IT and business users require services including support, maintenance, training and more. Companies which can address those needs can build a strong business and Revolution is trying to do so with R.

GUI As Indicative Of Other Issues

I mentioned the GUI earlier. It is very simple and still aimed at very technical users, people doing heavy programming and who understand detailed statistics. I asked why and was told that they felt that was their audience. However, Bill had earlier talked about analytics moving forward from the data priests to business analysts and end users. That’s a dichotomy. The expressed movement is a reason for their vision and mission, but their product doesn’t seem to support that mission.

Even worse was the response when I pointed out that I’d worked on the Apple Macintosh before and after MPW was released and had worked at Gupta when it was the first 4GL language on the Windows platform. I received as long winded answer as to why going to a better and easier to use GUI wasn’t in the plans. Then Mr. Jacobs mentioned something to the effect of “You mentioned companies earlier and they don’t exist anymore.” Well, let’s forget for a minute that Gupta began a market, others such as Powersoft did well too for years, and then Microsoft came out with its Visual products to control the market but that there were many good years for other firms and the products are still there. Let’s focus on wondering when Apple ceased to exist.

It’s one thing to talk about a bigger market message in the higher points of a business presentation. It’s another, very different, thing to ensure that your vision runs through the entire company and product offering.

Along with the Vision mentioned above, Revolution Analytics presents a corporate mission to “Drive enterprise adoption of R by providing enhanced R products tailored to meet enterprise challenges.” Enterprise adoption will be hindered until the products reflect an ability to work for more than specialist programmers but can address a wider enterprise audience.

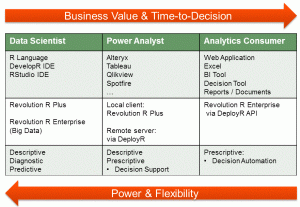
Part of the problem seems to be shown in the graphic below.

Revolution Analytics tech view of today

Revolution deserves credit for accurately representing the current BI space in snapshot. The problem is that it is a snapshot of today and there wasn’t an indication that the company understands how rapidly things change. Five to ten years ago, the middle column was the left column. Even today there’s a very technical need for the people who link the data to those products in order to begin analysis. In the same way, much of what is in the right column was in the middle. In only a few years, the left column will be in the middle and the middle will be on the right.

Software evolves rapidly, far more rapidly that physical manufacturing industries. Again, in order to address their enterprise mission, Revolution Analytics’ management is going to have to address what’s needed to move towards the right columns that mean an enterprise adoption.

Enterprise Scalability: A Good Start

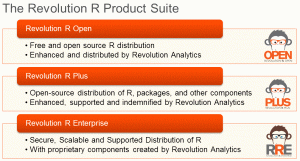
One thing they’ve done very well is to build out the product suite to attract different sized businesses, individual departments and others with a scaled product suite to attract a wider audience.

Revolution Analytics product suite

Revolution Analytics product suite

They seem to have done a good job of providing a layered approach from free use of open source to enterprise weight support. Any interested person should talk with them about the full details.

Summary

R is a very useful analytical tool and Revolution Analytics is working hard to provide business with the ability to use R in ways that help leverage the technology. They’re working hard to support groups who want pure free open source and others who want true enterprise support in the way other open source companies have succeeded in previous decades.

Their tool does seem powerful, but it is still clearly and admittedly targeted at the very technical user, the data priests.

Revolution Analytics seems to have a start to a good corporate mission and I think they know where they want to end up. The problems is that they haven’t yet created a strategy that will get them to meet their vision and mission.

If you are interested in using R to perform complex analysis, you need to talk to Revolution Analytics. They are strong in the present. Just be aware that you will have to help nudge them into the future.

MicroStrategy at BBBT: A BI Giant Working to Become More Agile

Last Friday’s BBBT presentation was by Stefan Schmitz, VP Product Management, MicroStrategy. This will be a short post because a lot of the presentation was NDA. Look to MicroStrategy World in January for information on the things discussed.

The Company

The primary purpose of the public portion of the presentation was to discuss the reorganization and refocus of MicroStrategy. Stefan admitted that MicroStrategy has always been weak on marketing and that in recent years Michael Saylor has been focused on other issues. Mr. Schmitz says those things are changing, Saylor is back and they’re focusing on getting their message out. In case you’re wondering why a company that claims to be pushing marketing showed up with only a product management guy, they’d planned on also having a product marketing person but life intervened. Stefan’s message clearly had strong marketing input and preparation so I believe the focused message.

When we discussed the current market, Paul te Braak, another BBBT member, asked a specific question about where MicroStrategy saw self-service analytics. Stefan responded, accurately, it was self-service for analysts only and systems are too simple and miss real data access.

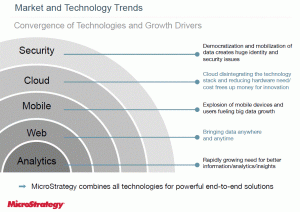
One key point was the company’s view of the market as shown below.

MicroStrategy market view

The problem I have is that data governance isn’t there. It’s in some of the lower level details presented later, but that’s not strong enough. The blend of user empowerment and corporate governance requirements won’t be met until the later is perceived as a top criticality by technical folks. MicroStrategy is a company coming from the early days of enterprise business intelligence and I’d expect them to emphasize data governance the way a few other recent presenters have done, and the lack of that priority is worrisome.

The Technology

On the technology side, there were two key issues mentioned in the open session.

The first was a simplification of the product line. As Mr. Schmitz pointed out, they had 21 different products and that caused confusion in the market, slowing sales cycles and creating other problems. MicroStrategy has simplified its product structure to four products: The server, the architect for developing reports and dashboards, and separate products for Web and mobile delivery.

The second is an AWS cloud implementation along with data warehousing partners in order to provide those products as part of a scalable and complete package. This is aimed at helping the company move downstream to address departmental, divisional and smaller company needs better than their history of mainstream IT sales has allowed.

This is still evolving and the company can give more information, as you’d expect.

More was mentioned but, again, it was under NDA.

Summary

MicroStrategy is an established BI vendor, one of the older group of companies and, unlike Cognos and Business Objects, still standing on its own. The management knows that the newer vendors have started with smaller installations and are moving towards enterprise accounts. It is making changes in order to go the other direction. The company wants to expand from the core enterprise space into the newer and more agile areas of BI. Their plans seem strong, we’ll have to watch how they implement those plans.

Yellowfin at BBBT: Visualization and Data Governance Begin to Meet

Last Friday’s BBBT presentation was by Glen Rabie, CEO, and John Ryan, Product Marketing Director, from Yellowfin. I reviewed their 7.1 release webinar in late August but this was a chance to hear a longer presentation focused for analysts.

Their first focus was on the BARC BI Survey 14. One point is that they were listed as number one, by far, in how many sites are using the product in a cloud environment. That’s interesting because Yellowfin does not offer a cloud version. This is corporations installing their own versions on cloud servers.

A Tangent: Cloud v On-Premises?

That brings up an interesting issue. Companies like to talk about cloud versus on-premises (regardless of the large number of people who don’t seem to know to use the “s”) installations, but that’s not really true. Cloud can be upper case or lower. Upper case Cloud computing is happening in the internet, outside a company’s firewall. However, many server farms, both corporate owned and third party, are allowing multi-server applications to run inside corporate firewalls the same way they’d run outside. That’s still a cloud installation by the technical methodology, but it’s not in the Cloud. It’s on-premises in theory, since it’s behind the firewall.

Time for a new survey. We’re talking about multi-server, parallel processing applications verses single server technology. What’s a good name for that?

Back to Our Regularly Scheduled Diatribe

One bit of marketing fluff I heard is that they claim to be the first completely browser based UI. I’ve heard from a number of other vendors who have used HTML5 to provide pure browser interfaces, so I don’t know or care if they were first. The fact that they’re there is important, as is the usability of the interface. The later matters more. As I mentioned in the v7.1 review, they don’t hide that they’re focused on the business analyst rather than the end user, and for that target audience it is a good interface.

An important issue that points to a maturation of business intelligence in the market place was indicated by a statement John Ryan made about their sales. Yellowfin used to be almost exclusively based on sales to small pilot projects, then working to increase the footprint in their clients. He mentioned that they’ve seen a recent and significant increase in the number of leads that are coming into the funnel as full enterprise sales from the start. That’s both a testament to IT reviewing and accepting the younger BI companies and to Yellowfin’s increased visibility in the market.

“All About the Dashboard” and Data Governance

Glen and John repeatedly came back to the idea that they’re all about providing dashboards to the business user, focusing on letting technical people do discovery and the tough work then just addressing visualization for the end user. The idea that the technical people should do the detailed discovery and the business user show just look at things, slicing and dicing in a limited fashion, might be a reason they’re seeing more enterprise sales.

They seem to be telling IT that companies can get modern visualization tools while still controlling the end users. That’s still a priests at the temple model. That’s not all bad.

On one side, they’ll continue to frustrate end users by limiting access to the information they want to see. On the other side, many newer firms are all about access and don’t consider data governance. Yes, we want to empower business knowledge workers, but we also need to help companies with regulatory and contractual requirements for data governance.

Yellowfin seems to be walking a fine line. They have some great data governance capabilities built in, with access control and more. One very useful function is the ability to watermark reports as to their approved status within the company. It might seem minor, but helping viewers understand the level of confidence a firm has in certain analysis is clearly an advantage.

An interesting discussion occurred in the session and on Twitter about a phrase used in the presentation: Governed Data Discovery. Some analysts think it’s an oxymoron, that data discovery shouldn’t be governed or limited or it’s not discovery. I think it makes a lot of sense because of the need for some level of controls. Seeing all data makes no sense for many reasons, and governance is required. Certainly, too tight governance and control is a problem, but I like where Yellowfin seems to be going on that front.

But What About the Rest of BI?

As mentioned, Yellowfin is working to let analysts build reports and help knowledge workers consume reports. However, the reports are built from data. Where’s that come from? Who knows?

When I asked how they get the information, they clearly stated they weren’t interested in the back end of BI, not ETL, not databases. They’re leaving that to others. That’s a risk.

Glen Rabie pointed out, earlier in the presentation, that many of their newer clients are swap-outs of older BI technologies. For instance, he said two of his more recent clients in Japan had swapped out Business Objects for Yellowfin. Check the old Business Objects press releases from customers in the last couple of decades. The enterprise sales weren’t “Business Objects sells…” but rather “Business Objects and Informatica,” “Business Objects and Teradata,” etc. visualization is the end of a long BI process and enterprises want the full information supply chain.

As long as Yellowfin is both clear about its focus and prepared to work closely with other vendors in joint sales situations then it won’t be a problem as the company grows. They need to be prepared for that or they’ll slow the sales cycle.

Social Media Overthought

The final major point is about Yellowfin’s functionality for including social media within the product to enhance collaboration. While the basic concept is fine and their timeline functionality allows a team to track the evolution of the reports, I have two issues.

First, the product doesn’t link with other corporate-wide social tools. That means if a Yellowfin user wants to share something with someone who doesn’t need to use the tool, a new license is needed. I know that helps Yellowfin’s top line, but I think there should be some easy way of distributing new analysis for feedback from a wider audience without a full license.

Second, and much less important, is the mention of allowing people to vote on the reports. I was amused. It reminded me of a great quote from the late Patrick Moynihan, “Everyone is entitled to his own opinion, but not to his own facts.” I think the basic social tool in Yellowfin is very useful, but voting on facts seems a tad excessive.

Summary

Glen Rabie and John Ryan gave a great overview of Yellowfin, covering both the company’s strategy and the current state of product. Their visualization is as good as most others and they have some of the most advanced data governance capabilities in the BI industry.

There’s a lot of good going on down under. Companies wanting modern visualization tools should take a look, with one caveat. If you think that the power of modern systems means that functionality is clearly moving forward and should allow business users to do more than they have been able to do, Yellowfin might not match up with other firms. If you think that end users only want dashboards and want a good way of providing business workers with those dashboards, call now.

Webinar Review: Big Data addressed poorly

I’ve been in computing business for almost thirty five years, but until this year it was always working for vendors or systems integrators. As a newly minted analyst, I’ve stayed away from very negative reviews. I’ve watched a few bad webinars recently and made the choice not to blog about them. However, as I’ve seen more and more, I’ve realized that doesn’t help the industry and I can’t remain silent.

On Tuesday, I watched a webinar by David Loshin, President of Knowledge Integrity, and Ramesh Menon from Cray. It was not pretty.

Let’s take, for instance, David Loshin’s five points for big data:

  • Plan for scalability
  • Go heavy on Memory
  • Free your applications from the Hadoop 1.0 Execution Model
  • Real-time ingestion and integration
  • Feed the SQL need

The first item has been around since client/server application first came to the fore. Big data has grown, in part, because of its ability to scale large volumes of data. This is nothing new.

Memory? It was a great point years ago, with Tableau and others having pushed it for quite a while. However, the last year or two we’ve been hitting the limits of pure memory solutions and I’ve seen a number of presentations from vendors focused on better integrating memory and disk depending on data latency needs. David’s statement that ““We will start seeing more applications using memory rather than disk,” is wrong. We’ll see more applications better leveraging memory, but disk isn’t going anywhere.

The Hadoop organization’s release of Hadoop v2, YARN, is a clear indication of the limitations of 1.0 and why people have also been talking about it for years. However, in the presentation, leading with 2.0 would have been better than again being a laggard about the known issues with 1.0. Either people use Hadoop and already know the issues or haven’t yet used it and will start with 2.0.

It’s not real-time ingestion the critical issue and I would have liked to see him focus more on the second half of the fourth bullet. Real-time extractions of information are moving much more rapidly than the ability to integrate it with the rest of corporate information and to provide analytical to that information.

David’s final point is the only timely one. People have recently begun to remember that evolution is easier than revolution and I’ve seen a number of vendors begin to focus on providing access to the new data sources via SQL. A lot more people providing business insight to corporations know SQL and that needs to be made available. Ramesh Menon said it better, but the point is here.

The biggest problem I had was with Loshin’s forward looking statement. I’ll almost ignore that nonsense about data lake, he’s not the only one busy trying to use a new, supposedly fancier, term for the ODS, but I’ll mention it anyway. The issue was that he claimed he saw data management moving away from the data lake as we move to in-memory. Really? The ODS isn’t going anywhere. It’s nonsense to thing that every bit of corporate information needs to reside in memory, just in case it might be needed. The ODS is becoming the central source of all operational and business data. Individual business intelligence tools and needs will drive in-memory usage for near real-time needs of specific departmental, divisional or corporate level analytics needs, but there will always be a non-memory source for all that information in order to provide consistency, appropriate levels of control and to handle data governance issues.

Now we turn to Ramesh Menon. His presentation was better than David Loshin’s, but not by much. I’m sorry, there’s no excuse for someone who puts himself forward as a voice of the industry to not understand the difference between a premise and a premises. Considering he used premise correctly in his presentation, it was terrible that it was used three times before that while describing “on-premise” computing. Everyone in our industry needs to sit down, focus and practice saying the right word.

His customer use case was a very jumbled story and an overcrowded slide with the main point being “the customer had a lot of data.” I wouldn’t have guessed. He needs to talk more about solutions, how Cray address the data.

As mentioned above, Ramesh had a very clear point about the difference between data scientists and business analysts being one reason that Hadoop 2.0 is important. The move from batch to lower latency access is part of the difference between a data scientist, someone wanting to be the priest at the temple, and a business analyst, a much larger group working to provide wider access to business information. Updating Hadoop is critical to the ability to keep it relevant.

That was a key point, the problem is that Ramesh isn’t the analyst, he’s Cray’s spokesperson. The discussion shouldn’t have been about generalities but about how Cray must have focused on Hadoop 2.0 for the Urika-XA appliance – but that wasn’t made clear. It was in the data sheet images plopped into the presentation, but reasons and results should have been openly discussed.

I’ll end with the one very interesting point from Mr. Menon’s presentation. He had a slide where he discussed four phases in the analytics pipeline: ETL, algorithms, analysis and visualization. His point is that there are very different resource requirements for each phase of the pipeline. This could be an entire presentation itself and Ramesh could focus and expand this, explaining how Cray helps to address part or all of those requirements to help present Cray to the industry.

Summary

The analysis got a couple of things right, but was mostly too late or wrong. The corporate presentation didn’t clearly link Cray to the issues involved. Both presentation halves were far to generic and descriptive with almost no descriptive takeaways. Furthermore, you could tell that neither presenter seemed to have put much time and effort into the webinar by both the content and presentation styles.

People need to learn that “there’s no such thing as bad press” is only something said by entertainers. It’s not enough to have a webinar to get your name out there. Lots and lots of companies are doing that. Thought needs to go into the presentation and practice needs to go into delivery.

There were some good tidbits in the presentation, but overall it was a mess. I was very disappointed in the hour that I lost.

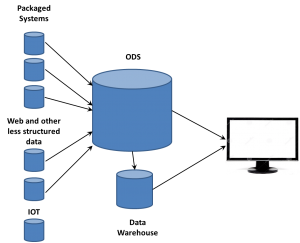
An ODS by any other name still smells like data

Data warehouse theory originally posited extracting data from systems, performing transformations on them and loading the resulting schemas into the data warehouse. It was a straight flow of information. However, the difference between theory and practice quickly reared its head. Today, people are talking about Data Lakes and Data Swamps. They’re not new, they’re just the ODS updated for modern data.

Data Warehouses and the ODS

Academics don’t have to deal with operational systems. In the 1980s and 1990s, those systems were growing, with ERP, CRM and other systems increasing the complexity and volume of data. Those mission critical systems, however, weren’t designed for extraction of information. They were primarily running on RDBMS systems that had locking schemas that could grind process and transactional systems to a halt while and extraction program kept open large blocks of records while transforming basic data in star schemas. Something needed to be done.

There was also a secondary effect that was very important to some people. IT, just as with ever other department in a large enterprise, isn’t monolithic. The people managing the operational systems knew their systems were mission critical and also knew how, in reality, those systems were big but fragile. They weren’t happy with opening their operational systems to other IT folks who were interested in non-operational things. Those folks answering other business problems? They were viewed as intruders, getting in the way of the “real work.”

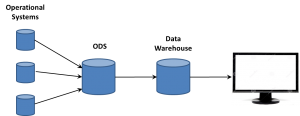
For both reasons, intrusions into the operational systems were something to be kept to a minimum. IT organizations began using an Operational Data Store (ODS) to quickly open the operational systems, suck all the data out, willy-nilly (yes, I decided to use that term in a tech article…), and then go back to prime performance in an isolated system.  ODS 1

It was then the ODS that was the source of the data warehouse ETL process. On a tangent, this is why the people now arguing about ETL v ELT amuse me. It’s been ELETL for decade, if we want to be honest; but who cares? I’d rather have a BLT than spend so many cycles over slightly different acronyms for concepts that ETL handily describes, even in permutations.

The ODS comes into its own

The IT folks who were working to provide reports for mid- and high-level managers were always trying to tweak enterprise software reports, trying to extract nuggets of value. The data warehouse was a step forward and helped build a bigger picture. However, the creation of star schemas and other DW techniques aggregated data and lots a lot of detail. A manager would see an issue and want to backtrack, to drill-down into the data to know more.

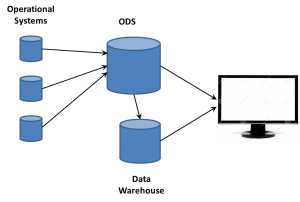
The ODS became the way to do so. Very quickly, the focus changed from ODS in front of the data warehouse to both working side-by-side. Having all that raw data available gave the business analysts a way of providing much more detail and information to the business user. The first big BI companies, those such as Cognos, Business Objects and more, leveraged the two data stores to provide an ability to drill down past the aggregate information into the more detailed data.ODS 2

Having that large volume of data from multiple operational systems also intrigued people who weren’t data warehouse focused. They wanted to sift the raw data for technical or performance trends, things that weren’t of interest to the typical DW designers and users, but were important to mid-level management in manufacturing, marketing and other departments. Business analysts supporting those people began to turn to more and more analysis directly on the ODS data

The ODS comes to the fore – by another name

That was happening in the 1990s, at the same time another key phenomenon was growing: The Web. The growth of the web meant a lot more data about a lot more things. Web sites are operational systems to marketing in just as critical a way as an assembly line is to manufacturing. People became interested in ensuring that what visitors to web sites did was captured and available for analysis. However, as the volume of web traffic grew exponentially, new issues had to be looked at to handle that data.

Columnar databases were one solution, a way to speed up analysis of dimensions of information across individual records. The vastly larger amount of data also helped push emerging MPP technologies and drove creation of Hadoop and other technologies that could manage much larger data sources much faster and more cost efficiently than could individual Unix servers.

However, the web folks were new to IT and grew up in a different generation than the folks who designed and drove data warehousing. It’s natural to ODS 3want to take ownership of concepts, especially those on the edge. So the folks working with these new data sources began talking about Big Data as somehow completely different than what came before. If that was the case, they needed to think of some term for the database where they dumped all the data extracted from web sites. Data Lakes became one term. We’ve heard data swamp and other attempts to create unique terms so a company can differentiate itself from others. However, there’s already a name.

The ODS exists. It’s evolved. It’s moved forward. But it’s still the ODS.

Yes, really

“But,” you say, “an ODS is operational information and the data lake is so much more!” Well, not quite. There are two main problems with that argument.

First, times change. When the ODS was coined, the focus was on the back-end systems such as ERP, CRM, accounting and other fairly closed systems. It was before the web, before the ubiquity of mobile devices, before the wall between back-end and customer-facing systems was destroyed.

As mentioned, not just web sites are but even the internet is an operational system for your business – and not just for ecommerce companies. From lead generation, to maintenance and training, the internet is a key tool for providing operational support and generating business critical operational details.

Second, just as ETL can mean a number of things, so can ODS extend past a pure theory while still being relevant. CRM systems are considered operational but still contained sentiment and other information in comments fields. Just so, the vast volume of data from a call center’s voice recording system being dumped into the ODS have two components. There are basic details about the operation of the call center, things such as number of calls, call length and other details that are purely operational. There are also additional details about customers that can be distilled for strategy purposes, including the ability to provide sentiment analysis. Just because an operational system captures data that can be used for more than purely operational decision making doesn’t obviate that the information extracted resided in an ODS.

Summary

It’s a need of information technologists from all generations to realize that things change but retain context. The ODS isn’t what it was thirty years ago, but the data lake also isn’t some new creation born full blown from the web. There are few truly revolutionary technologies. You can be a brilliant person and contribute much to technology and business and still not be a revolutionary.

The ability to manage the vastly larger amounts of data than we had twenty years ago is critical. There are many innovative things being done. However, I consider the first expert systems, the first MPP algorithms and other similar technologies to be revolutionary. The fact that what is being done to allow business to gain insight combining more and more data from even more diverse sources is no less valuable to the industry because it is instead an evolutionary change.

The ODS has evolved. It doesn’t need a new name, just a tad more respect.

Webinar: IBM, Actuate and Cirro describe faster analytics

Today a webinar was hosted by Database Trend and Applications. While there are important things to talk about, I’ll start with the amusing point of the inverse relationship between company size and presenter title found in every webinar, but wonderfully on display here. The three presenters were:

  • Mark Theissen, CEO, Cirro
  • Peter Hoopes, VP/GM, BIRT Analytics Division, Actuate
  • Amit Patel, Program Director, Data Warehouse Solutions Marketing, IBM

The topic was “Accelerating your Analytics for Faster Insights.” That is a lot to cover in less than an hour, made more brief by a tag team of three people from different companies. I must say I was pleasantly surprised with how well they integrated their messages.

Mark Theissen was up first. There were a lot of fancy names for what Cirro does, but think ETL as it’s much easier. Mark’s point is that no single repository can handle all enterprise data even if that made sense. Cirro’s goal is to provide on-demand distributed analytics, using federation to link multiple data sources in order to help businesses analyze more complete information. It’s a strong point people have forgotten in the last few years during the typical “the latest craze will solve everything” focus on Hadoop and minimizing the role of getting to multiple sources.

Peter Hoopes then followed to talk about doing the analytics. One phrase he used should be discussed in more detail: “speed wins.” So many people are focused on the admittedly important area of immediate retail feedback on the web and with mobile devices. There, yes, speed can win. However, not always. Sometimes though helps too. That’s one reason why complex analysis for high level business strategy and planning is different that putting an ad on a phone as you walk by a store. There are clear reasons for speed, even in analytics, but it should not be the only focus in a BI decision.

IBM’s Amit Patel then came on to discuss the meat of the matter: DB2 Blu. This is IBM’s foray into in-memory, columnar databases. It’s a critical ad to the product line. There are advantages to in-memory that have created a need for all major players to have an offering, and IBM does the “me too!” well; but how does IBM differentiate itself?

As someone who understands the need for integration of transaction and analytic systems and agrees both need to co-exist, I was intrigued by what Amit had to say. Transactions going into normal DB2 environment while being shadowed into columnar BLU environment to speed analytics. Think about it: Transactions can still be managed with the row-oriented technologies best suited for them while the information is, in parallel, moved to the analytics database that happens to be in memory. It seems to be a good way to begin to blend the technologies and let each do what works best.

For a slightly techhie comment, I did like what Mr. Patel was saying about IBM’s management of memory and CPU. After all, while IBM is one of the largest software vendors in the world, too many folks forget their hardware background. One quick mention in a sentence about “hardware vendors such as Intel and IBM…” was a great touch to add a message that can help IBM differentiate its knowledge of MPP from that of pure software companies. As a marketing guy, I smiled big time at the smooth way that was brought up.

Summary

The three presenters did a good job in pointing out that the heterogeneous nature of enterprise data isn’t going away, rather it’s expanding. Each company, in its own way, put forward how it helps address that complexity. Still, it takes three companies.

As the BI market continues to mature, the companies who manage to combine the enterprise information supply chain components most smoothly will succeed. Right now, there’s a message being presented by three players. Other competitors also partner for ETL, data storage and analytics. It sounds interesting, but the market’s still young. Look for more robust messages from single vendors to evolve.

TDWI, Claudia Imhoff and SAP: Data Architecture Matters

In a busy week for TDWI webinars, today’s presentation by Claudia Imhoff, Intelligent Solutions, and Lother Henkes, SAP, was about how the continuing discussion of the place in the data world for the data warehouse.

While many younger techies think the latest technology is a panacea and many older techies are far too skeptical for too long, the reality is that while the data warehouse is going nowhere, it has to integrate with the newer technologies to continue improving the information being provided to business knowledge workers.

One of Claudia’s early slides talked about data sources. While most people are focused on both the standard packaged software and the rush of non-structured data from the Web, call centers, etc, Claudia makes clear the item that companies are just beginning to realize and address: Sensor data is just as important as the rest and also driving data volumes. Business information continues to come from further afield and a wider variety of sources and all must be integrated.

Much of her talk, she mentioned, has come out of a couple of years of work between herself and Colin White, in formalizing the changing data architecture environment. Data warehouses are still the place for production reports and analytics, where data provenance and clarity are absolutely necessary while the techniques used on early stage data such as in streaming, Hadoop analytics, etc, are more exploratory and investigative. The duo posit that the combination of data integration, data management (including EDWs), data analysis and decision management are the “glue in the middle,” those things that bind sources, deployment and distribution technologies, and reporting and analytics options into a real system that provides value.

The picture they put together is good and Claudia Imhoff’s presentation should be looked at for a better understanding of where we are; but I wouldn’t be me if I didn’t have a couple of issues.

The first is a that she is a bit too enamored of mobile technology. It’s here and must be addressed, but statements such as “nobody has a desktop, everything is mobile” must be corrected. A JD Power survey last year showed that only 20% of tablets are used for work. On the other side, Forrester Research has pointed out a strong majority of business people are now using two devices for their information.

The issue for business intelligence is not that people are switching from desktops (including laptops in docking stations) but that smart providers of information need to build UIs that address the needs of large monitors, tablets and smartphones, addressing each device’s uniqueness while ensuring a similarity of user experience.

The second issue is a new term thrown out during the presentation. It’s “data refinery” and, as Claudia mentioned in her presentation, it’s the same thing others are calling a data swamp, data lake or numerous other terms. There’s an easy term everyone has used for years: Operational Data Store (ODS). I’m a marketing guy and I understand the urge for everyone to try to coin a term that will catch on, but it’s not needed in this case.

While it’s a separate topic (yeah, another concept for a column!), I’ll briefly point out my objections here. Even back in the late 1990s, during my brief sojourn at Informatica, we were talking about how the ODS can be used for more than only a place to use in order to quickly extract information from operational system so as not to stress them by doing transformations directly from such systems. They’ve always been a place to take an initial look at data before beginning transformations into star schemas and the like. The ODS hasn’t changed. What’s changed is the underlying technologies that support larger data stores and the higher level analytics that let us better analyze what’s in the ODS.

That brings us to one main point Claudia Imhoff made during her wrap-up, the section on business considerations. She points out that people really need to understand the importance of each data source and the data within it. Just because we can extract everything doesn’t mean we need to save everything. Her example was with customer sampling. Yes, you can get all the customer data, but only that which you need to narrow cast. For higher level decision making, those who understand confidence levels know that sampling can get to very high levels of certainty so sampling can still speed decision making and save costs. Disk space might be less expensive in the Cloud, but it’s not free. We’re in the job of helping businesses improve themselves, so we need to look at the bigger picture.

Her presentation was clearly strategic: We need to rethink, not reinvent, data modeling. Traditional techniques aren’t going away and neither are many of the new ones. Data management people need to understand how they combine.

No surprise, that was a great transition to Lother Henkes’ presentation. His key point is that SAP BW now can run on SAP HANA. It’s important even if all the capital letters look like shouting. HANA is SAP’s in memory, columnar database that’s their entry into the Cloud market to manage the high volumes of modern data. It’s a move to bridge the gap between the ODS and relational database arenas with one underlying infrastructure.

In such a brief webinar, it’s hard to see more than the theory, but it’s a clear move by SAP to do what Claudia Imhoff suggested, to take a fresh look at data models in order to understand how to better support the full range of data now being incorporated into business decision making.

TDWI and IBM on Predictive Analytics: A Tale of Two Focii

Usually I’m more impressed with the TDWI half of a sponsored webinar than by the corporate presentation. Today, that wasn’t the case. The subject was supposed to be about predictive analytics, but the usually clear and focused Fern Halper, TDWI Research Director for Advanced Analytics, wasn’t at her best.

Let’s start with her definition of predictive analytics: “A statistical or data mining solution consisting of algorithms and techniques that can be used on both structured and unstructured data to determine outcomes.” Data mining uses statistical analysis so I’m not quite sure why that needs to be mentioned. However, the bigger problem is at the other end of the definition. Predictive analysis can’t determine outcomes but it can suggest likely outcomes. The word “determine” is much to forceful to honestly describe prediction.

Ms. Halper’s presentation also, disappointingly compared to her usual focus, was primarily off topic. It dealt with the basics of current business intelligence. There was useful information, such as her referring to Dave Stodder’s numbers showing that only 31% of surveyed folks say their businesses have BI accessible to more than half their employees. The industry is growing, but slowly.

Then, when first turning to predictive analytics, Fern showed results of a survey question about who would be building predictive analytics. As she also mentioned it was a survey of people already doing it, there’s no surprise that business analysts and statisticians, the people doing it now, were the folks they felt would continue to do it. However, as the BI vendors including better analytics and other UI tools, it’s clear that predictive analytics will slowly move into the hands of the business knowledge worker just as other types of reporting have.

The key point of interest in her section of the presentation was the same I’ve been hearing from more and more vendors in recent months: The final admission that, yes, there are two different categories of folks using BI. There are the technical folks creating the links to sources, complex algorithms and reports and such, and there are the consumers, the business people who might build simple reports and tweak others but whose primary goal is to be able to make better business decisions.

This is where we turn to David Clement, Product Marketing Manager, BI & Predictive Analytics, IBM, the second presenter.

One of the first things out of the gate was that IBM doesn’t talk about predictive analytics but about forward looking business intelligence. While the first thought might be that we really don’t need yet another term, another way to build a new acronym, the phrase has some interesting meaning. It’s no surprise that a new industry where most companies are run by techies focused on technology, the analytics are the focus. However, why do analytics? This isn’t new. Companies don’t look at historic data for purely nostalgic reasons. Managers have always tried to make predictions based on history in order to better future performance. IBM’s turn of phrase puts the emphasis on forward looking, not how that forward look is aided.

The middle of his presentation was the typical dog and pony show with canned videos to show SPSS and IBM Cognos working together to provide forecasting. As with most demos, I didn’t really care.

What was interesting was the case study they discussed, apparel designer Elie Tahari. It’s a case study that should be studied by any retail company looking at predictive analytics as a 30% reduction of logistics costs is an eye catcher. What wasn’t clear is if that amount was from a starting point of zero BI or just adding predictive analytics on top of existing information.

What is clear is that IBM, a dinosaur in the eyes of most people in Silicon Valley and Boston, understands that businesses want BI and predictive analytics not because it’s cool or complex or anything else they often discuss – it’s to solve real business problems. That’s the message and IBM gets it. Folks tend to forget just how many years dinosaurs roamed the earth. While the younger BI companies are moving faster in technology, getting the ears of business people and building a solution that’s useful to them matters.

Summary

Fern Halper did a nice review of the basics about BI, but I think the TDWI view of predictive analytics is too much industry group think. It’s still aligned with technology as the focus, not the needs of business. IBM is pushing a message that matters to business, showing that it’s the business results that drive technology.

Businesses have been doing predictive analysis for a long time, as long as there’s been business. The advent of predictive analytics is just a continuance of the march of software to increase access to business information and improve the ability for business management to make timely and accurate decisions in the market place. The sooner the BI industry realize this and start focusing less on just how cool data scientists are and more on how cool it is for business to improve performance, the faster adoption of the technology will pick up.