Tag Archives: claudia imhoff

TDWI Webinar Review: Claudia Imhoff and SAP with an overview of the analytics supply chain

Tuesday’s TDWI webinar had a guest star: Claudia Imhoff. The topic was predictive analytics and the presentation was sponsored by SAP, so Pierre Leroux, Director of Product Marketing, SAP, also had his moment towards the end. Though the title was about predictive analytics, it’s best to view the presentation as an overview of the state of analytics, and there’s much more to discuss on that.

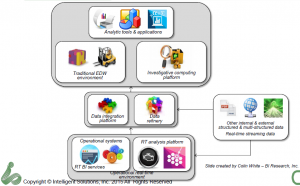
The key points revolved around a descriptive slide Ms. Imhoff presented to describe the changing analytics landscape.
TDWI Imhoff analytics supply chain

Claudia Imhoff described the established EDW information supply chain as being the left half of the diagram while the newer information, with web, internet of things (IOT) and other massive data sources adding the right hand side. It’s a nice, clean way of looking at things and makes clear that the newer data can still drive rather than eliminate the EDW.

One thing I’d say is missing is a good name for the middle box. Many folks call was Ms. Imhoff terms the Date Refinery a Data Lake or other similar rationalizations. My issue is that there’s really no need to list the two parts separate. In fact, there’s a need to have them seamlessly accessible as a whole, hence the growth of SQL for Hadoop and other solutions. As I’ve expressed before, the combination of the data integration and data refinery displayed are just the next generation of the ODS. I like the data refinery label, but think it more accurately applies to the full set of data described in the middle section of the diagram.

Claudia also described, the four types of analytics:

  • Descriptive: What happened.
  • Diagnostic: Why it happened.
  • Predictive: What might happen.
  • Prescriptive: What to do when it happens.

It’s important to understand the difference in analysis because each type of report needs to have a focus and an audience. One nit I have with her discussion of these was the comment that descriptive analytics are the least valuable. Rather, they’re the least strategic. If we don’t know what happened, we can’t feed the other types of analytics, plus, reporting requirements in so much of business means that understanding and reporting what happened remains very valuable. The difference is not how valuable, but in what way. Predictive and prescriptive analytics can be more valuable in the long term, but their foundation still resides on descriptive.

Not more with the Data Scientist…

My biggest complaint with our industry at large is still the obsession with the mythical data scientist. Claudia Imhoff spent a good amount of time on the subject. It’s a concept with super human requirements, with Claudia even saying that the data scientist might be the one with deep business knowledge. Nope. Not going to happen.

In Q&A, somebody brought up the point I always mention: Why does it have to be one person rather than a team. Both Claudia Imhoff and Pierre Leroux admitted that was more likely. I wish folks would start with that as it’s reasonable and logical.

I was a programmer as folks began calling themselves software engineers. I never liked that. The job wasn’t engineering but a blend of engineering and crafting. There was art. The two presenters continued to talk about the data scientist as having an art component, but still think that means the magical person is still a scientist. In addition, thirty year ago the developer was distanced much further from business, by development methods, technology and business practice. Being closer means, again, teamwork, with each person sharing expertise in math, coding, business and more to create a robust solution.

That wall has been coming down for years, but both technology and business are changing rapidly and are far more complex. The team notion is far more logical.

Business and Technology

The other major problem I had was a later slide and words accompanying it that implied it’s up to the business people to get on board with what the technologists are doing. They must find the training, they must learn that analytics are the answer to everything.

Yes, we’re able to provide better analytics faster to management than in the past. However, they’re not yet perfect nor will they be. Models are just that. As Pierre pointed out, models will never explain 100%.

Claudia made a great point earlier about one of the benefits of big data is to eliminate sampling and look at what the entire market is doing, but markets are still complex and we can’t glean everything. Technologists must get of the high horse and realize that some of the pushback from management is because the techies too often tend to dismiss intuition and experience. What needs to happen is for the messages to change to make it clear that modern analytics will help executives and line management make better decisions, not that it will replace their decision making.

In addition, quit making overly complex visualization that have great scientific relevance but waste time. The users do not need to understand the complexities of systems. If we’re so darned smart, we can distill the visualizations to things easier to comprehend so that managers can get the information, add it to all the other information and experience and make decision.

Technologists must adapt to how business runs as much as business must adapt to leverage technology.

Summary

The title of the presentation misrepresents the content. It was a very good presentation for understanding the high level landscape of the analytics information supply chain and it’s a discussion that needs to be held more often.

You’ll notice I didn’t say much about the demo by Pierre Leroux. That’s because of technical issues between demo and webinar software. However, both he and Claudia Imhoff took questions about the industry and market and gave thoughtful answers that should help drive the conversation forward.

Silwood at BBBT: Understand Packaged Software Metadata

Tuesday saw a rare, mid-week presentation at the BBBT. Silwood Technology, an Ascot, UK, company sent people to Boulder to present their technology. Roland Bullivant, Sales and Marketing Director, and Nick Porter, Technical Director (and a co-founder) were the presenters.

Silwood Safyr is focused on helping IT understand the metadata in their major packaged enterprise systems, primarily from SAP and Oracle with a recent addition of Salesforce. As those familiar with the enterprise application space know, there are a lot of tables in SAP and Oracle and documentation has never been, shall we say, close to perfect. In addition, all customers of those systems customize the applications, thereby making the metadata more difficult to understand. Safyr does a very good job at finding the technical metadata.

Let me make that clear: Technical metadata. The tables, indices and their relations are what is found. That’s extremely valuable, but not the full picture. Business metadata is not managed. I’ll discuss that in more detail below.

The company, as expected from European companies, uses partners rather than direct sales for its primary sales channel. In addition, they OEM white label products through IBM, CA and other firms. All told, Roland Bullivant says that 70% of their customers are via reseller channels. Also as expected, they still remain backline support for those partners.

Metadata Matters

As mentioned above, Safyr captures the database structure metadata. As Roland so succinctly put it, “The older packages weren’t really built with the outside world in mind.” The internal structures aren’t pretty and often aren’t easily accessible. However, that’s not the only difficulty in understanding an enterprise’s data structures.

Salesforce has a much simpler data structure, intentionally created to open the information to the ecosystem of partner applications that then grew up around the application. Still, as Mr. Bullivant pointed out, there are companies in Europe that have 16 or more customized versions in different countries or divisions, so understanding and meshing those disparate systems in order to build a full enterprise data model isn’t easy. That’s where Safyr helps.

But What Metadata?

Silwood Safyr is a great leap forward from having nothing, but there’s still much missing. While they build a data model, there’s not enough intelligence. For instance, they leave it to their users to figure out which tables are production and which are duplicates or other tables used just for performance. Sure, a table with zero rows usually means either a performance table or an unlocked app segment, but that’s left for the user rather than flagging, filtering and indicating any knowledge of the application and data structures.

Also, as mentioned above, there’s no business intelligence (gosh, where’d that word come from?). There’s nothing that lets people understand the business logic of the applications. That’s why this is a pure IT tool. The structures are just described in technical terms, exported to data modeling tools (a requirement for visualization, ERwin was used in the demo but they work with others ) and then left to the analysts to identify all the information need to clarify which tables are needed for which business purpose or customer.

One way to start working on that was indicated in Nick Porter’s demo. He showed that Safyr is good at not just getting table names, but also in accessing descriptive names and other metadata about the tables. That’s information needs to be leveraged to help prepare the results for use by people on the business side of the organization.

Where to Go From Here?

The main hole I see in the business links from the last section: The lack of emphasis on business knowledge. For instance, there’s a comparison function to analyze metadata between databases. However, as it’s purely on a technical level, it’s limited to comparing SAP with SAP and Oracle with Oracle. Given that differences in versions of those products can be significant, I’m not even sure how well that works across major version releases.

Not only do global enterprises have multiple versions of one vendor, they have SAP on one continent, Oracle in another and might acquire a new company that is using Salesforce. That lack of an ability to link business layers means that each package is working in a void and there’s still a lot of work required to build a coherent global picture.

Another part of their growth need is my usual soapbox. When the Silwood team was talking about how they couldn’t figure out why they weren’t growing as fast as they should, Claudia Imhoff beat me to the punch. She mentioned marketing. They’d earlier pointed out they don’t spend much on marketing and she quickly pointed out that’s a problem. This isn’t Field of Dreams, they won’t come just because you build it. Silwood marketing basics are good, with a lack of visible case studies being one hole, but they’re not pushing their message out through the channels.

Summary

Silwood Safyr is a good core product to help IT automate the documentation of data models in packaged enterprise software. It’s a product that should be of interest to every large enterprise using complex applications such as those by Oracle and SAP, or even multiple versions of simple databases such as Salesforce. However, there are two things missing.

The most important missing piece in the short term is the marketing necessary to help their resellers better understand benefits both they and the end customer receive, to improve interest in reselling and to shorten sales cycles.

The second is to look long term at where they can grow the business. My suggestion is to better work with business logic within and across applications vendors. That’s the key way they’ll defend their turf against the BI vendors who are slowly moving downstream to more technical data access.

The reason people want to understand data models isn’t out of curiosity, it’s to better understand business. Silwood has a great start in aiding enterprises in improving that understanding.

TDWI, Claudia Imhoff and SAP: Data Architecture Matters

In a busy week for TDWI webinars, today’s presentation by Claudia Imhoff, Intelligent Solutions, and Lother Henkes, SAP, was about how the continuing discussion of the place in the data world for the data warehouse.

While many younger techies think the latest technology is a panacea and many older techies are far too skeptical for too long, the reality is that while the data warehouse is going nowhere, it has to integrate with the newer technologies to continue improving the information being provided to business knowledge workers.

One of Claudia’s early slides talked about data sources. While most people are focused on both the standard packaged software and the rush of non-structured data from the Web, call centers, etc, Claudia makes clear the item that companies are just beginning to realize and address: Sensor data is just as important as the rest and also driving data volumes. Business information continues to come from further afield and a wider variety of sources and all must be integrated.

Much of her talk, she mentioned, has come out of a couple of years of work between herself and Colin White, in formalizing the changing data architecture environment. Data warehouses are still the place for production reports and analytics, where data provenance and clarity are absolutely necessary while the techniques used on early stage data such as in streaming, Hadoop analytics, etc, are more exploratory and investigative. The duo posit that the combination of data integration, data management (including EDWs), data analysis and decision management are the “glue in the middle,” those things that bind sources, deployment and distribution technologies, and reporting and analytics options into a real system that provides value.

The picture they put together is good and Claudia Imhoff’s presentation should be looked at for a better understanding of where we are; but I wouldn’t be me if I didn’t have a couple of issues.

The first is a that she is a bit too enamored of mobile technology. It’s here and must be addressed, but statements such as “nobody has a desktop, everything is mobile” must be corrected. A JD Power survey last year showed that only 20% of tablets are used for work. On the other side, Forrester Research has pointed out a strong majority of business people are now using two devices for their information.

The issue for business intelligence is not that people are switching from desktops (including laptops in docking stations) but that smart providers of information need to build UIs that address the needs of large monitors, tablets and smartphones, addressing each device’s uniqueness while ensuring a similarity of user experience.

The second issue is a new term thrown out during the presentation. It’s “data refinery” and, as Claudia mentioned in her presentation, it’s the same thing others are calling a data swamp, data lake or numerous other terms. There’s an easy term everyone has used for years: Operational Data Store (ODS). I’m a marketing guy and I understand the urge for everyone to try to coin a term that will catch on, but it’s not needed in this case.

While it’s a separate topic (yeah, another concept for a column!), I’ll briefly point out my objections here. Even back in the late 1990s, during my brief sojourn at Informatica, we were talking about how the ODS can be used for more than only a place to use in order to quickly extract information from operational system so as not to stress them by doing transformations directly from such systems. They’ve always been a place to take an initial look at data before beginning transformations into star schemas and the like. The ODS hasn’t changed. What’s changed is the underlying technologies that support larger data stores and the higher level analytics that let us better analyze what’s in the ODS.

That brings us to one main point Claudia Imhoff made during her wrap-up, the section on business considerations. She points out that people really need to understand the importance of each data source and the data within it. Just because we can extract everything doesn’t mean we need to save everything. Her example was with customer sampling. Yes, you can get all the customer data, but only that which you need to narrow cast. For higher level decision making, those who understand confidence levels know that sampling can get to very high levels of certainty so sampling can still speed decision making and save costs. Disk space might be less expensive in the Cloud, but it’s not free. We’re in the job of helping businesses improve themselves, so we need to look at the bigger picture.

Her presentation was clearly strategic: We need to rethink, not reinvent, data modeling. Traditional techniques aren’t going away and neither are many of the new ones. Data management people need to understand how they combine.

No surprise, that was a great transition to Lother Henkes’ presentation. His key point is that SAP BW now can run on SAP HANA. It’s important even if all the capital letters look like shouting. HANA is SAP’s in memory, columnar database that’s their entry into the Cloud market to manage the high volumes of modern data. It’s a move to bridge the gap between the ODS and relational database arenas with one underlying infrastructure.

In such a brief webinar, it’s hard to see more than the theory, but it’s a clear move by SAP to do what Claudia Imhoff suggested, to take a fresh look at data models in order to understand how to better support the full range of data now being incorporated into business decision making.