Tag Archives: tdwi

TDWI Webinar Review: Claudia Imhoff and SAP with an overview of the analytics supply chain

Tuesday’s TDWI webinar had a guest star: Claudia Imhoff. The topic was predictive analytics and the presentation was sponsored by SAP, so Pierre Leroux, Director of Product Marketing, SAP, also had his moment towards the end. Though the title was about predictive analytics, it’s best to view the presentation as an overview of the state of analytics, and there’s much more to discuss on that.

The key points revolved around a descriptive slide Ms. Imhoff presented to describe the changing analytics landscape.

TDWI Imhoff analytics supply chain

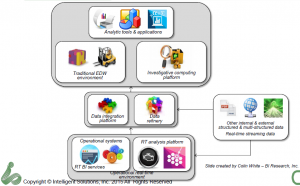
Claudia Imhoff described the established EDW information supply chain as being the left half of the diagram while the newer information, with web, internet of things (IOT) and other massive data sources adding the right hand side. It’s a nice, clean way of looking at things and makes clear that the newer data can still drive rather than eliminate the EDW.

One thing I’d say is missing is a good name for the middle box. Many folks call was Ms. Imhoff terms the Date Refinery a Data Lake or other similar rationalizations. My issue is that there’s really no need to list the two parts separate. In fact, there’s a need to have them seamlessly accessible as a whole, hence the growth of SQL for Hadoop and other solutions. As I’ve expressed before, the combination of the data integration and data refinery displayed are just the next generation of the ODS. I like the data refinery label, but think it more accurately applies to the full set of data described in the middle section of the diagram.

Claudia also described, the four types of analytics:

  • Descriptive: What happened.
  • Diagnostic: Why it happened.
  • Predictive: What might happen.
  • Prescriptive: What to do when it happens.

It’s important to understand the difference in analysis because each type of report needs to have a focus and an audience. One nit I have with her discussion of these was the comment that descriptive analytics are the least valuable. Rather, they’re the least strategic. If we don’t know what happened, we can’t feed the other types of analytics, plus, reporting requirements in so much of business means that understanding and reporting what happened remains very valuable. The difference is not how valuable, but in what way. Predictive and prescriptive analytics can be more valuable in the long term, but their foundation still resides on descriptive.

Not more with the Data Scientist…

My biggest complaint with our industry at large is still the obsession with the mythical data scientist. Claudia Imhoff spent a good amount of time on the subject. It’s a concept with super human requirements, with Claudia even saying that the data scientist might be the one with deep business knowledge. Nope. Not going to happen.

In Q&A, somebody brought up the point I always mention: Why does it have to be one person rather than a team. Both Claudia Imhoff and Pierre Leroux admitted that was more likely. I wish folks would start with that as it’s reasonable and logical.

I was a programmer as folks began calling themselves software engineers. I never liked that. The job wasn’t engineering but a blend of engineering and crafting. There was art. The two presenters continued to talk about the data scientist as having an art component, but still think that means the magical person is still a scientist. In addition, thirty year ago the developer was distanced much further from business, by development methods, technology and business practice. Being closer means, again, teamwork, with each person sharing expertise in math, coding, business and more to create a robust solution.

That wall has been coming down for years, but both technology and business are changing rapidly and are far more complex. The team notion is far more logical.

Business and Technology

The other major problem I had was a later slide and words accompanying it that implied it’s up to the business people to get on board with what the technologists are doing. They must find the training, they must learn that analytics are the answer to everything.

Yes, we’re able to provide better analytics faster to management than in the past. However, they’re not yet perfect nor will they be. Models are just that. As Pierre pointed out, models will never explain 100%.

Claudia made a great point earlier about one of the benefits of big data is to eliminate sampling and look at what the entire market is doing, but markets are still complex and we can’t glean everything. Technologists must get of the high horse and realize that some of the pushback from management is because the techies too often tend to dismiss intuition and experience. What needs to happen is for the messages to change to make it clear that modern analytics will help executives and line management make better decisions, not that it will replace their decision making.

In addition, quit making overly complex visualization that have great scientific relevance but waste time. The users do not need to understand the complexities of systems. If we’re so darned smart, we can distill the visualizations to things easier to comprehend so that managers can get the information, add it to all the other information and experience and make decision.

Technologists must adapt to how business runs as much as business must adapt to leverage technology.

Summary

The title of the presentation misrepresents the content. It was a very good presentation for understanding the high level landscape of the analytics information supply chain and it’s a discussion that needs to be held more often.

You’ll notice I didn’t say much about the demo by Pierre Leroux. That’s because of technical issues between demo and webinar software. However, both he and Claudia Imhoff took questions about the industry and market and gave thoughtful answers that should help drive the conversation forward.

TDWI Webinar Review: What is Data Platform as a Service (dPaaS) and What Can it Do For Your Business?

Yesterday’s TDWI webinar was sponsored by Liaison Technologies, who did the same thing last year. It’s a push for another acronym. While the acronym isn’t needed, the concept is. Data Platform as a Service is just using the cloud to help with data integration. Gosh, complex, ‘eh? I think it’s the natural progression of technology and business, it’s just data management on the cloud. But forget the marketing, let’s talk about the concept.

Cloud data management

The presentation’s first half was delivered by Phillip Russom. He started with some very trivial level setting but then quickly got to a key point. If you’ve been around for a while, you remember Best of Breed. That’s when each vendor focused product company, somewhere in the information supply chain, talked about their openness and how you could piece together a solution from different vendors. That made sense at the time, since many companies were each creating the early version of parts of a full solution.

As Phillip pointed out, times have changed. We now better understand business needs, have learned more about coding the requirements and can access far better hardware than we had fifteen years ago. That means IT is looking for what they couldn’t find back then: An integrated solution from a single or a far more limited number of vendors. They want something simpler than a hodgepodge of multiple systems.

The advantages of the cloud aren’t specific to data management. One very key business driver that was minimized in Mr. Russom’s presentation but brought out later by Patrick Adamiak during his presentation then revisited by both in the Q&A is capex versus opex – something often ignored by technical folks. Having your own hardware and data center is not just costly, it’s part of capital expenditure. Service contracts with a cloud vendor are operational expenses. That means the CxO suite and Board are often happier with that because it’s not as locked it and creates flexibility in the corporate financial picture.

One nit I had with Mr. Russom’s presentation was his statement that cloud is another architecture, like client/server or the web. The cloud and web are client server, that’s not the issue. It’s another architecture in two other key aspects: The already mentioned capex/opex divide, and the way it changes a software vendor’s ability to manage and update their software in comparison to on-premises installations.

One caution he gave that needed more explanation for folks new to the cloud was when Mr. Russom mentioned that you need to ask about the elasticity of the cloud implementation. For those who might not have heard the term, elasticity is the ability to grow or shrink cloud resources in order to match processing demands. In other words, if you get a big data dump from another source, can you quickly access more disk space? Or, from the Web side of the house: You’re hosting a big event or making a major announcement on your Web site: Can site resources be replicated quickly to handle the additional load then released when no longer needed?

Liaison

I was impressed by the fact that capex was mentioned on Patrick Adamiak’s first slide. Cloud technology has multiple advantages that can be communicated to IT, but it’s the capex/opex issue that will help close the deal in an enterprise setting. Liaison seems to understand the need to blend technical and business messages.

However, most of Mr. Adamiak’s presentation seemed to be about justifying the new acronym. The main slide compared dPaaS with other supposed solutions without admitting there’s really a lot of overlap between them. The columns weren’t as different as he’d like them to be.

His company slides didn’t seem any different than those I’ve seen from the many other firms in the space. Forget all of that, it was in a short webinar with TDWI, so he had limited time.

The fact is that Liaison claims they are where the market is going. They are vertically integrating the information supply chain while leveraging the cloud for its business and technology advantages. For those in IT looking to simplify their world, Liaison is a company that should be investigated.

TDWI Best Practices Report on Hadoop: A good report for IT, not executives

The latest TDWI Best Practices Report is concerned with Hadoop. Philip Russom is the author and the article is worth a read. However, it has the usual issue I’ve seen with many TDWI reports, very strong on numbers but missing the real business point. In journalism, there’s an expression called burying the lede, hiding the most important part of a story down in the middle. Mr. Russom gets his analysis correct, bit I think the priorities or the focus needs work. It’s a great report to use as a source by IT, it’s not a report for executives.

Why am I cranky? The report starts with an Executive Summary. The problem is that it isn’t aimed at executives but is something that lets technical folks think they’re doing well. It doesn’t tell executives why they should care. What are the business benefits? What are the risks? Those things are missing.

First, let’s deal with the humorous marketing number. The report mentions the supposedly astounding figure that “Hadoop clusters in production are up 60% in two years.” That’s part of the executive summary. You have to slide down into the body to understand that only 16% of respondents said they have HDFS production. It’s easy for early adopters to grow a small percent to a slightly larger small percentage, it’s much tougher to get a larger slice of the pie.

Philip Russom accurately deals with why it will take a bit for Hadoop to grow larger, but it does it past the halfway point of the article. Two things: Security and SQL.

Executives are concerned that technology helps business. Security ensures that intellectual property remains within the firm. It also ensures that litigation is minimized by not having breaches that could be outside regulatory and contractual requirements. Mr. Russom accurately discusses the security risks with Hadoop, but that begins down on page 18 and doesn’t bubble up into the executive summary.

So too is the issue of SQL. After writing about the problems in staffing Hadoop, the author gives a brief but accurate mention of the need to link Hadoop into the rest of a business’ information infrastructure. It is happening, as a sidebar comment points out with “Hadoop is progressively integrated into complex multi-platform environments.” However, that progress needs to speed up for executives to see the analytics from Hadoop data integrated into the big picture the CxO suite demands.

The report gives IT a great picture of where Hadoop is right now. As expected from a technical organization, it weighs the need, influence and future of the mystical data scientist too highly, but the generalities are there to help mid-level management understand where Hadoop is today.

However, I’ve seen multiple generations of technology come in, and Hadoop is still at an early adopter phase where too many proponents are too technical to understand what executives need. It’s important to understand risks and rewards, not a technical snapshot; and the later is what the report is.

IT should read this report as valuable insight to what the market is doing. It’s, obviously, my personal bias, but the summary is just that, a summary. It’s not for executives. It’s something that each IT manager will use for its good resources to build their own messages to their executives.

TDWI Webinar: Embedded Analytics

The latest TDWI webinar was on embedded analytics. The speakers were Fern Halper, the director of TDWI research for advanced analytics, and Mark Gamble from OpenText. For those of you who hadn’t heard, Actuate was acquired by OpenText and is being rebranded but, according to Mark, will remain an independent division for now.

Ms. Halper’s main point is that embedded has a lot of different meanings for different audiences and that she wants to create a clear framework for understanding the terminology within the analytics space. She’s clear that what’s meant isn’t just into the mass market idea of wearable software, but that analytics can be embedded in specific applications, broader systems and, yes, devices such as mobile and wearable items.

Early in the presentation she presented a two axis image comparing structured and unstructured data combined with human and machine generated data. While I think the coloring should rotate, to emphasize that the difference between machine versus human generated information is a bigger issue than structured v unstructured, it’s a nice way of understanding some of the data streams.

TDWI Embedded Analytics - Data Sources

That, however, was a definitional slide and discussion. The real mean of Fern Halper’s presentation was the framework she described to help understand the steps of embedding analytics.

TDWI Embedded Analytics - Framework

Operationalized analytics are those that are involved in the full process of decision making. For instance, a call center employee might be talking to a prospect whose finances are flagged as a question mark. That prospect must be sent to another person to process the decision based on analytics.

Integrated analytics are those that allow the call center operator to see the analysis and immediately make decisions based upon guidelines.

Automated analytics are those that provide the operator with a decision tree response based on analytics done behind the scenes.

The only issue I take with the framework is it doesn’t necessarily mean true real time. The example discussed shows that the integrated approach can be real time for what humans think of as real time within our own interactions. Meanwhile, real-time might not be a necessary component to some automated decisions. Real-time is a separate issue and I think Fern’s framework would be better served by eliminating that item.

Fern Halper followed the framework with the usual and interesting TDWI survey numbers. This time, the questions were focused on the adoption of analytics tied to the framework. The numbers showed the unsurprising fact that analytics adoption is still in its infancy. One of the great parts of TDWI’s numbers is they show the reality which contradicts the industry’s hype.

One set of numbers I’d like to see wasn’t included. The responses were only IT responses in general, who has started using what analytics. I would have loved to see one slide that clearly showed only the sub-segment of companies who are already using analytics tools and where those companies are within Ms. Halper’s framework. Are are the bleeding edge folks doing at moving through the framework to automated solutions?

OpenText

The rest of the program was a fast presentation by Mark Gamble, pointing to OpenText’s (Actuate’s) main benefit claim of enterprise scalability and the other factors. One of the phrases I liked was his reference stating they “adhered to a low code methodology.” It’s nice to hear folks admitting that as much as we want to eliminate coding, some of that is still required. Honesty isn’t a negative in marketing and I liked that turn of phrase.

In the other direction, he mentioned there were over fourteen million downloads of BIRT and that the company “believes” they have over three million users. I’m not interested in belief but they don’t seem to have a clear figure on adoption.

The main problem I had was the demo. Mark showed experimental work positing to show live acquisition of basic automotive information such as speed and RPM displayed on a computer, phone and watch. It was not only not a business case but one that seemed to go back to the misunderstanding about the meaning of embedded which was addressed by Fern. Yes, it was embedded on two devices, but the demo didn’t show how it might be embedded in business applications. It stuck with the flashy concept of wearables.

OpenText might have something good with their analytics portability, but I don’t think the demo presents it to a business audience. Yes, techies will understand the underpinnings that make it cool, but the business folks writing checks need to see something that justifies the expenditure and I don’t think that’s shown.

Summary

Fern Halper did another good job of putting the adoption of analytics into perspective. This time, with a framework for better understanding embedded analytics.

Mark Gamble did a passable job of presenting OpenText’s solution but I feel he must do a better job of figuring out a business message.

TDWI’s data shows the early state of adoption that exists in the market. Fern Halper’s framework will help companies better understand how to move into the arena, but only if the companies providing those solutions can better present how they’ll help solve business issues.

Webinar Review. Lyndsey Wise and Information Builders: Five Ways SMBs are Putting Information to Work

This morning I attended a TDWI webinar with Lyndsay Wise, Wise Analytics, and Chris Banks, Information Builders, presenting the subject line topic. It was a nice change from the webinar earlier in the week.

Lyndsey Wise began by speaking about the differences between Small-to-Medium sized businesses (SMBs) and enterprises. While SMBs are smaller and have fewer resources than enterprises, they are also more adaptive and can more quickly make decisions that impact corporate infrastructure.

I’ll disagree with what she said in that description on only one point. Ms. Wise mentioned the lack of internal IT resources makes SMBs more comfortable with consultants, the Cloud and information appliances. Two out of three ‘aint bad. Appliances tend to be a capital expense made by enterprises wanting to retain control inside the firewall. They give enterprises more comfort. SMBs don’t typically want that kind of investment and overhead. She’s absolutely right that’s why many external IT consultants and web software vendors have successfully focused on the market.

She then turned to a discussion of the following five ways SMBs are better utilizing information:

  • Embedded BI within operations
  • Web portal expansion and information sharing
  • Mobilization of the workforce
  • Better flexibility in dashboard and analytics design – self-service and data discovery
  • Monetizing of data collected

The first point was that SMBs have had to deal far longer than did enterprises with separate operational and BI software that barely overlapped if you were lucky. Operational software companies have begun to add BI to their packages while BI vendors are better linking to operational systems, both at the data end and up front through single-signon and other interfaces enhancements that aid integration.

The growth of web portals is not new and not really in the pure BI space, but it is a key part of the solution, as Ms. Wise points out for the reason that it helps businesses share with customers, suppliers and other people and organizations in their ecosystems. I’m glad she had the point there because many people in tech sectors get focused just on their niche and don’t look at the full information picture.

Workforce mobilization issues are the same for any size business. The only difference I see is that SMBs have fewer resources for training. People wanting to focus on SMBs need to ensure that mobile apps go through user interface design cycles to present clear and easy understanding of critical information.

The fourth point is critical. It ties into what I mentioned in the previous paragraph. As Lyndsey Wise pointed out, SMBs don’t tend to have programmers, especially not ones with the inflated title of data scientist (full disclosure, “inflated” is my opinion not hers), That means UI, UI, UI. True self-service is a must for SMBs.

The final issue is another on which I’m on the fence as to the importance. Not that monetization is unimportant, just that monetization of information has been important to business for millennia before computers. All BI is ultimately about making better business decisions and that usually means a predominate roll in lower costs or increasing revenue. That’s information monetization. It’s not that the point is unimportant, it just seems redundant to me.

The presentation was then turned over to Chris Banks. Information Builders, one of the big first generation BI firms, seems to be making a big push to remind people it’s there. Given the short time frame, Chris intelligently shortened and breezed through his presentation. He gave a good overview of the breadth and depth of his company’s offerings.

The issue I have with Mr. Banks’ presentation is, no surprise to anyone who knows I focus on marketing, is how he presented the company. Information Builders, Cognos, Business Objects, et al, grew up in a time when enterprises were trying to understand the large amounts of data in multiple operational systems. They spent decades on an enterprise sell. Chris is working to position them to fit Wise’s SMB message, but he’s not there yet.

Showing a crowded diagram of the breadth of products is scary to SMBs, even with Chris’ caveat that he’d never expect anyone to buy all the products. He should have focused on a simpler slide showing how SMBs can quickly begin using his products.

Then he transitioned to a slide showing a portal, backing Ms. Wyse’s second point. Sadly, it was the Hertz portal. Not exactly an SMB play.

That continued with a NASCAR slide of global enterprise customers and a case study from a large US bank. It wasn’t until the very end that there was a case study on an SMB, a roofing contractor that achieved insight and business benefit from Information Builder’s tools.

Summary

Lyndsey Wise had a good overview of issues facing small-to-medium sized businesses when trying to better gather, manage and understand business information.

Information Builders is working to communicate with the SMB community and made an ok first stab. From the presentation, I’m not really sure how they can help, but I’m not convinced they can’t. There’s much more work to be done to better address and important market.

TDWI Webinar and Best Practices Report: Real-Time Data, BI and Analytics

TDWI held a webinar this morning to promote their new Best Practices Report on real-time data, BI and analytics. It’s worth a glance.

The report and presentation were team efforts by Philip Russom, David Stodder, and Fern Halper. The report, as usual, was centered around a survey and was a survey of IT people rather than business users. The report relates, “The majority of survey respondents are IT professionals (63%), whereas the others are consultants (20%) and business sponsors or users (17%).” Not much room there for the opinions of the people who need to use BI. Still, for understanding the IT perspective, it’s interesting.

The most valuable pointer in the presentation was given by Dave Stodder, who pointed out what too many folks ignore: Much of the want for real-time data is bounded by the inability of the major operational systems, such as ERP and CRM, to move from batch to real-time support. While BI firms can prepare for that, it’s the other vendors providing and the users adopting systems that allow real-time extraction in an effective manner that is the big bottleneck to adoption.

One issue that the TDWI folks and many others in our industry have is a misconception around the phrase “operational systems.” Enterprise software folks have grown up thinking of operations as synonymous with business operations. That’s not the case. All three of the analysts made that error even while discussing the fact that the internet of things means more devices are becoming data sources.

Those people who provide manufacturing software understand that and have for years. There’s much that can be leveraged from that sector but I don’t hear much mentioned in our arena. Fern Halper did mention IT operations as an area already using basic analytics, but I think the message could be stronger. Network management companies have decades of experience in real time monitoring and analysis of performance issues and that could be leveraged.

Build, buy or borrow are options for software as well as other industries, but I only see people considering building. We should be looking more to other software sectors for inspiration and partnerships.

There was also a strange bifurcation that Dave Stodder and Fern Halper seem to be making, by splitting BI and analytics. Analytics are just one facet of BI. I don’t see a split being necessary.

At the end of the presentation, they reviewed their top ten priorities (page 43 of the report). Most are very standard but I’ll point to the second, “Don’t expect the new stuff to replace the old stuff.” It’s relevant to the discussion vendors seem to think that revolutionary trumps evolutionary. It doesn’t. Each step in new forms of BI, such as predictive analytics, extends the ability to help business users make better decisions. It’s layered on top of the rest of the analysis to build a more complete picture, it doesn’t replace it.

TDWI / Actuate Webinar on Visualization: Not much there

Maybe it’s because of the TDWI conference now going on in San Diego, but this morning’s webinar on “Making Data Beautiful for Business Users” seemed a bit of an afterthought. The presenters were Dave Stodder, TDWI Director of Research, and Allen Bonde, VP Product Marketing and Innovation, Actuate. There were a few interesting moments, but not a lot of even basic content.

Dave Stodder began with a whole bunch of quotes from other people. I admit, it’s a quick way to put together a presentation, but then you should paraphrase and explain why the quotes matter rather than just reading them verbatim – we, the audience, are already doing that.

However, then he got to the three main goals of improving visualization in BI:

  • Improving self-service
  • Shortening the path to insight
  • Advancing business agility

To be honest, those are accurate but also valid for every other point in reporting throughout history. Businesses always want to enable decision makers to help make more accurate and timely decisions through better information.

What followed was one of the keys to TDWI success: An interesting slide based on one of their surveys.TDWI Visualization ROI Focus slide

Improved operational efficiency was a clear number one. The problem is that the data is most likely from IT respondents rather than from business users. I asked the question about that but it wasn’t answered. I predict that if you asked business users you’d find the second two items, faster response and identify new opportunities, would be at the top.

One important point Dave Stodder made was about alert fatigue. It’s tempting to have visualizations and other tactics that alert anytime things change, but too many alerts mean people stop paying attention. It reminded me of my days as a sales engineer, back in the days of pagers. Another SE and I had to sit down one of the sales people and explain that if he appended 911 to every page then nothing was important.

The only part purely focused on visualizations were two slides. One was just a collection of a few visualization types and the other was another TDWI survey about which visualization types are currently being implemented. There wasn’t a discussion of the appropriateness of the ones being used the most, any reason to better focus on some being ignored, or any discussion about how many are provided by packaged BI tools versus are home grown by the supposedly valuable data scientists.

Allen Bonde then took over and didn’t focus on visualization. He gave a rather generic Actuate sales pitch, mentioning platforms built for scale, the importance of an open community and didn’t show any visuals on visualization.

It wasn’t that the presentation was terrible, it’s only that it was far too generic. What was said about visualizations could be said about just about any reporting and there wasn’t really any direct focus on visualization. It’s one thing to quote Tufte, it’s another to have a discussion about current tools and what’s coming. That later was missed.

Maybe after the conference we’ll see another webinar with clearer focus.

TDWI and IBM on Predictive Analytics: A Tale of Two Focii

Usually I’m more impressed with the TDWI half of a sponsored webinar than by the corporate presentation. Today, that wasn’t the case. The subject was supposed to be about predictive analytics, but the usually clear and focused Fern Halper, TDWI Research Director for Advanced Analytics, wasn’t at her best.

Let’s start with her definition of predictive analytics: “A statistical or data mining solution consisting of algorithms and techniques that can be used on both structured and unstructured data to determine outcomes.” Data mining uses statistical analysis so I’m not quite sure why that needs to be mentioned. However, the bigger problem is at the other end of the definition. Predictive analysis can’t determine outcomes but it can suggest likely outcomes. The word “determine” is much to forceful to honestly describe prediction.

Ms. Halper’s presentation also, disappointingly compared to her usual focus, was primarily off topic. It dealt with the basics of current business intelligence. There was useful information, such as her referring to Dave Stodder’s numbers showing that only 31% of surveyed folks say their businesses have BI accessible to more than half their employees. The industry is growing, but slowly.

Then, when first turning to predictive analytics, Fern showed results of a survey question about who would be building predictive analytics. As she also mentioned it was a survey of people already doing it, there’s no surprise that business analysts and statisticians, the people doing it now, were the folks they felt would continue to do it. However, as the BI vendors including better analytics and other UI tools, it’s clear that predictive analytics will slowly move into the hands of the business knowledge worker just as other types of reporting have.

The key point of interest in her section of the presentation was the same I’ve been hearing from more and more vendors in recent months: The final admission that, yes, there are two different categories of folks using BI. There are the technical folks creating the links to sources, complex algorithms and reports and such, and there are the consumers, the business people who might build simple reports and tweak others but whose primary goal is to be able to make better business decisions.

This is where we turn to David Clement, Product Marketing Manager, BI & Predictive Analytics, IBM, the second presenter.

One of the first things out of the gate was that IBM doesn’t talk about predictive analytics but about forward looking business intelligence. While the first thought might be that we really don’t need yet another term, another way to build a new acronym, the phrase has some interesting meaning. It’s no surprise that a new industry where most companies are run by techies focused on technology, the analytics are the focus. However, why do analytics? This isn’t new. Companies don’t look at historic data for purely nostalgic reasons. Managers have always tried to make predictions based on history in order to better future performance. IBM’s turn of phrase puts the emphasis on forward looking, not how that forward look is aided.

The middle of his presentation was the typical dog and pony show with canned videos to show SPSS and IBM Cognos working together to provide forecasting. As with most demos, I didn’t really care.

What was interesting was the case study they discussed, apparel designer Elie Tahari. It’s a case study that should be studied by any retail company looking at predictive analytics as a 30% reduction of logistics costs is an eye catcher. What wasn’t clear is if that amount was from a starting point of zero BI or just adding predictive analytics on top of existing information.

What is clear is that IBM, a dinosaur in the eyes of most people in Silicon Valley and Boston, understands that businesses want BI and predictive analytics not because it’s cool or complex or anything else they often discuss – it’s to solve real business problems. That’s the message and IBM gets it. Folks tend to forget just how many years dinosaurs roamed the earth. While the younger BI companies are moving faster in technology, getting the ears of business people and building a solution that’s useful to them matters.

Summary

Fern Halper did a nice review of the basics about BI, but I think the TDWI view of predictive analytics is too much industry group think. It’s still aligned with technology as the focus, not the needs of business. IBM is pushing a message that matters to business, showing that it’s the business results that drive technology.

Businesses have been doing predictive analysis for a long time, as long as there’s been business. The advent of predictive analytics is just a continuance of the march of software to increase access to business information and improve the ability for business management to make timely and accurate decisions in the market place. The sooner the BI industry realize this and start focusing less on just how cool data scientists are and more on how cool it is for business to improve performance, the faster adoption of the technology will pick up.

TDWI Webinar Review: Business- Driven Analytics. Where’s business?

Today’s TDWI webinar was an overview of their latest best practices report. The intriguing thing was the numbers show that BI & Analytics still aren’t business driven. As Dave Stodder, Director of Research for Business Intelligence, pointed out, there are two key items contradicting that. First, more than half of companies have BI in less than 30% of the organization, pointing out that a large number of businesses aren’t prioritizing BI. Second, most of the responses to questions about BI show that it’s still something controlled and pushed by IT.

One point Dave mentioned was still the overwhelming presence of spreadsheets. They aren’t going away soon. A few vendors who have presented at the BBBT have also pointed out their focus at integrating spreadsheets rather than ignoring all the data that resides in them or demanding everything be collected in a data repository. The sooner more vendors realize they need to work with the existing business infrastructure rather than fight against it, the better off the industry will be.

Another interesting point was the influence of the CMO. I regularly read about analysts and others talking about how the “CMO has a bigger IT budget than the CIO!” The numbers from the TDWI survey don’t bear that out. One slide, a set of tables representing different CxO level positions’ involvement in different areas of the IT buying process show the CMO up near the CIO for identifying the need, but far behind in every other category – categories that include “allocate budget” and “approve budget.” In tech firms, and especially in Silicon Valley, people look around at other firms involved in the internet and forget they’re a small subset of the overall market.

Another intriguing point was brought out in the survey. Of companies with Centers of Excellence or similar groups to expand business intelligence, the list of titles involved in those groups shows an almost complete dearth of business users. It seems that IT still thinks of BI as a cool toy they can provide to users, not something that business users need to be involved in to ensure the right things are being offered. Only 15% show line of business management involved while a pathetic 4% show marketing’s involvement.

The last major point I’ll discuss is an interesting but flawed question/answer table. The question was on how the business-side leadership is doing during different aspects of a BI project. The numbers aren’t good. However, as we’ve just discussed, business isn’t included as much as they should be. There are two things that make me consider:

  • What would the pair of charts look like if the chart was split to look at how IT and business respondents each look at the question?
  • Is it an issue of IT not involving business or business not getting involved when opportunities are presented?

Summary

TDWI’s overview of the current state of business-driven BI & analytics seems to show that there’s a clear demand from the business community but there doesn’t seem to be the business involvement need to finish the widespread expansion of BI into most enterprises.

What I’d like to see TDWI focus on next is the barriers to that spread, the things that both IT and business see as inhibitors to expanding the role of modern BI tools in the business manager’s and CxO suite’s daily decision making.

It’s a good report, but only as a descriptive analysis of current state. It doesn’t provide enough information to help with prescriptive action.

TDWI: Evolving Data Warehouse Architectures in the Age of Big Data Analytics

Today’s TDWI webinar was a presentation by Philip Russom, Research Director, on “Evolving Data Warehouse Architectures in the Age of Big Data Analytics.” It was based on his just released research paper of the same name. Overall, it was a good overview of where their market survey shows the market, but I have a nit.

One of the best points Mr. Russom made was during his discussion of responses to “What technical issues or practices are driving change in your DW architecture. The top response, with 57%, was Advanced Analytics. Phillip pointed out to everyone that’s about as good a proof as you get in business driving technology. Advanced analytics is a business need and that pushing the technical decision. Too many people get too wrapped up in technology to realize it exists to solve problems.

TDWI what is data warehouse architecture
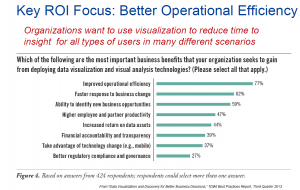
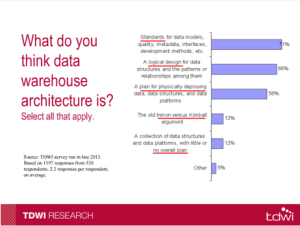
Another key point was made as to the evolving nature of the definition of data warehousing. Twenty years ago, it was about creating the repository for combining and accessing the data. That is now definition number three. The top two responses show a higher level business process and strategy in place than “just get it!”Where I have a problem with the presentation is when Mr. Russom stated that analytics are different than reporting. That’s a technical view and not a business one. His talk contained the reality that first we had to get the data, now we can move on to more in depth analysis, but he still thinks they’re very different. It’s as if there’s a wall between basic “what’s the data” and “finding out new things,” concepts he said don’t overlap. Let’s look at the current state of BI. A “report” might start with a standard layout of sales by territory. However, the Sales EVP might wish to wander the data, drilling down and slicing & dicing to understand things better by industry in territory, cities within and other metrics across territories. That combines what he defines as separate reporting and data discovery.

Certainly, the basic row-based reporting can switch to columnar structures for better analytics, but that’s techie. The business user sees a simple continuum. Like most other areas where technology advances (pretty much all of life…), business software solves a problem and then allows people to see past that one to the next. That successor problem doesn’t have to be completely different, and in the case of reporting and analytics, it’s not.

The final takeaway I received from his webinar helped support that concept even if his earlier words didn’t. He talked about the Multi-Platform Data Warehouse Environment, the fact that DW’s aren’t going anywhere, they’re only being incorporated into a wider ecosystem of data technologies in order to continue to improve the understanding and decision making capabilities of business managers.

Other than the disagreement I have with his view of reporting and analytics, I heard a good presentation and suggest people check out the full report.