Tableau was back at the BBBT last week. Last year’s presentation was a look ahead at v8.2. The latest visit was a look back at 2014 and a focus on v9.0. Francois Ajenstat, VP Product Management, was back again to lead us through product issues. The latest marketing presenter was Adriana Gil Miner, VP Corporate Communications.
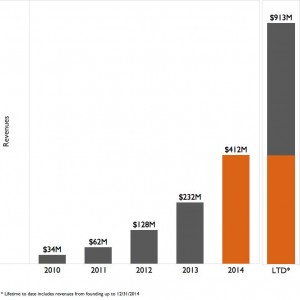
Ms. Gil Miner opened the morning with the look back at last year. The key point was thestrength of their growth. They are not only pleased with the year-over year growth, but thechart also shows last year’s revenue as a slice of revenue over Tableau’s lifetime. We’ll leave it simply as: They had a good year.
Another point in describing their size is that Adriana said they have 26,000 customer accounts. Some confusion with a later presentation number required clarification and this isn’t users, or even sites. We were told that the 26k is the number of paying company accounts. There were no numbers showing median account size or how far the outliers are on either extreme, but that’s a nice number for the BI space.
The final key point made by Adriana Gil Miner was localization. Modern companies almost all create products using unicode or other methods that allow for language localization, but Tableaus has made the strong push to provide localized software and data sets in multiple languages. My apologies for not listing them, there’s some weird glitch with my Adobe Reader that’s crashing only on their presentation while no other analyst is having the same problem, so I can’t provide a list. Please refer to your local Tableau rep for details.
Francois Ajenstat then took over. It was no surprise that his focus was on v9.0. He discussed it by focusing on nine points he views as key:
- Access to more data sources
- Answer more questions
- Improve the user experience
- Support analytics at scale
- Performance as a differentiator
- Support for mobile
- Tableau Public redesign
- Coming out next quarter
If you look at those, you might question why that many bullets? For instance, when it comes out is just a schedule issue and doesn’t rise to the level of the others. Tableau Public’s redesign just seems to be the obvious end of focusing on better user experience and performance.
However, a couple sound the same but should be differentiated. Analytics at scale and performance improvements overlap but aren’t identical. Francois showed both what they did to improve performance on clustered servers, helping both bigger data sources and more simultaneous users, and also demonstrating that they’ve done some great optimization in basic analytics for individuals.
One of the best parts was the honesty, now that they’re close enough to releasing v9.0, in admitting that early versions ran slowly. They showed quotes from beta testers talking about major performance improvements. In addition, Tableau Public is a great source of testing real-word analytics. Mr. Ajenstat pointed out that they took the 100 most accessed visualizations in Tableau Public and analyzed performand differences, seeing a 4x increase in performance on average. While it’s always important to generate internal tests to stress potential use, focusing on how business really use the tool is even more important in ensuring performance is seen as good in day-to-day usage by knowledge workers, not only in heavy loads by analysts doing discovery.
LOD Expressions
The one thing that really caught my eye about v9.0 is the incorporation of Level of Detail (LOD) expressions. BI firms have been adding drill-down analytics for a decade. Seeing a specific level of detail and then dropping down to a lower level is critical. However, that’s not enough.
What’s needed is to be able to visually compare the lower level details with overall numbers. For instance, a sales VP regularly wants to know not just how an individual sales person is doing, but also how that compares to the region and national numbers. Only within context can you gain insight.
Among the other things LODs help is the ability to bin aggregates. Again we can turn to sales to think about retail sales across categories while also comparing those to total sales or in a trend analysis.
While many companies are working to add more complex analysis, it’s clear that Tableau hasn’t only looked at how a very technical person can create an LOD. They’ve worked on an interface, that from the demo, has a simple and clean interface that business end users can user. Admittedly, that’s what demos are supposed to do, but I’ve seen some try and fail miserably. This seems to be a good attempt to understand business intelligence with an emphasis of the first word.
Summary
Some of the very new startups make the mistake of thinking even the first generation BI companies are too old to innovate. Those companies aren’t and are still a threat. However, Tableau is not even in the first generation and is still more nimble yet. They have their eyes on the ball and are moving forward. Even more importantly, while still focusing on their technology, as do many startups, they seem to have become mature enough to start shifting focus from the IT and business analysts to the information consumers.
Understanding what the business knowledge workers throughout the business hierarchy need, in data and performance, is what will drive the next growth spurt. Tableau seems to have them in target.