My latest Tech Target column is on storytelling.
Storytelling as evolution, not revolution
Leave a reply
My latest Tech Target column is on storytelling.
People at technology startups love to call the industry giants dinosaurs. The analogy fails for a number of reasons. The funniest is that the dinosaurs existed for many millions of years. As the large companies exist now, are the startups are saying the big companies will only disappear if we’re hit by a meteor? Companies became large by filling a need. While many might not be as nimble, their experience, especially in enterprise software, means they often see the needs of the business community while the small companies are focused too much on their “cool” technology.
This week’s Oracle webinar, hosted by the DBTA, was a good example of that. The speakers were Rich Clayton, VP Business Analytics Product Group, and Omri Traub, VP Software Development, and the subject was, no surprise, Oracle Big Data Cloud Service (OBDC. Yeah, I know. Too close to ODBC…). Before we get into the details, people need to be aware that Oracle is fully committed to the cloud, as pointed out in a recent advertorial in Forbes. Oracle is clearly competing with Amazon for enterprise cloud business. Big data is only one part of that.
Rich Clayton began the presentation by pointing towards Thomas Edison’s laboratory as an example of using the ideas from many people to not only invent things but also to figure out how to market those inventions. He brought that directly into the evolution of corporate data labs. The biggest problem, Rich stated, is that that labs are usually only populated by very technical people while they require a broader array of talents. That requirement is one of the data labs principles he defined and one I’ve also described as the missing component of many corporate data labs.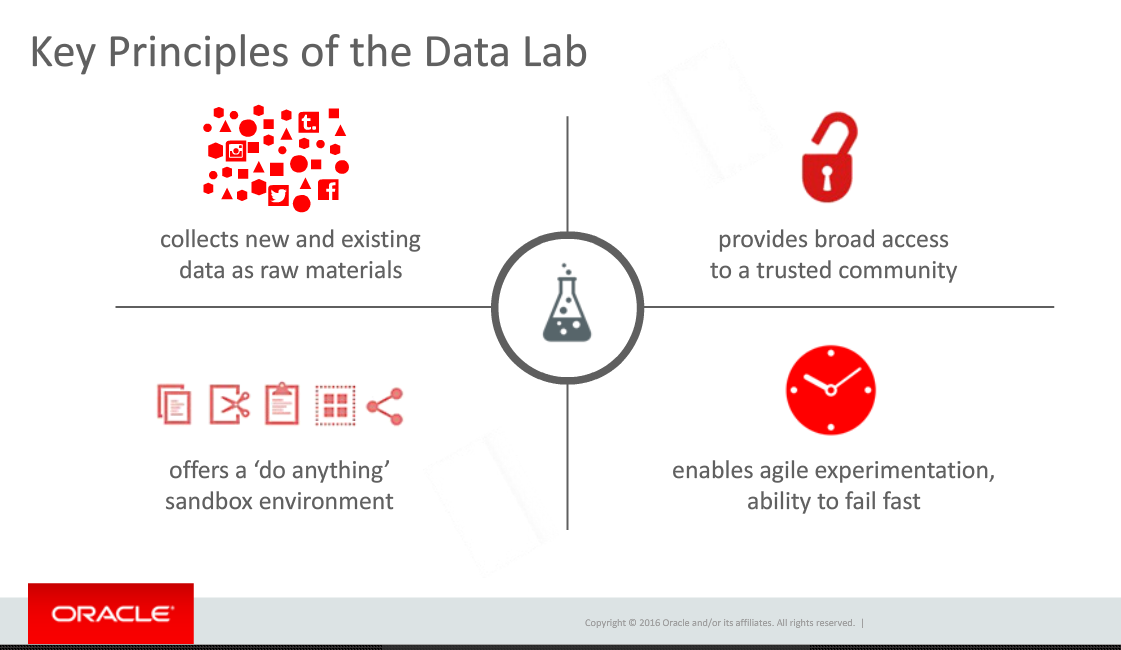
A related problem is that most products are so complex and silo’d that very technical people are needed. At this stage in business intelligence and big data, that’s the horse that needs to be addressed before the broad access cart can move.
Omri Traub then took over for the demonstration portion of the presentation. Unfortunately, he unintentionally proved the point about technical folks missing business needs by the setup he used for the demonstration. The demo was built around an enormous amount of information on New York City taxi information. While manipulating a billion record data set is cool and powerful, he never presented a business message. He pointed to the large volume of data, talked about other data sources he combined, and then played with the data to show correlations.
The problem? Omri, claimed we were gaining insight. Correlations aren’t insight. Understanding how those correlations might impact your business and ideas how to adapt business to meet what you find is insight. Nothing in the demonstration pointed towards insight.
Fortunately, Rich Clayton earlier had given a couple of case studies showing business insight gained by OBDC early customers. It would have been much better if Mr. Traub had focused on one of those cases or something similar.
The best point of the demonstration was when Omri showed how, in the middle of playing with some relationships, he easily incorporated some analysis created by a different person. As mentioned above, collaboration is critical and it looks like Oracle hasn’t limited that to just a marketing message but has worked to make sure that Oracle’s product helps the team. As many companies claim to do that and it was only an overview, your mileage might vary. Make sure when you talk to them to follow through and see whether the collaboration (not to mention the entire product…) meets your needs.
The final section was the Q&A. I’m a marketing person, so I have to be honest and state that it sounded like canned questions they wanted to address, as there was way too much about the full Oracle ecosystem brought into discussion at this point compared to what I’d expect from customers. Still, there was one important point.
A question was asked about what advanced analytics might be added. Mr. Taub had the perfect response. After quickly mentioning that, yes, Oracle was always looking at advanced analytics and how to add them, he made a much more important point. Collobaration is key and OBDC is designed to get business people involved. All analytics need to be added in a usable manner, in a way that is understandable and can be leveraged by more people than just the technical resources.
That is the critical viewpoint that a large, enterprise focused company can bring to BI, the cloud and big data. That’s why it’s foolish to write off the large companies, the ones with expertise in not just technology, but in business and business relationships. They might not move as fast, but they can move to the right places with the right products and the right business messages.
A presentation last week, hosted by Database Trends and Applications (DBTA), was a great example of some interesting technical information presented poorly. As that sentence implies, this column is one about the marketing of business intelligence (BI), not about the technology – well, not much…
There were three presenters: Brian Bulkowski, CTO and Co-founder, Aerospike; Kevin Petrie, Senior Director and Technology Evangelist, Attunity; Reiner Kappenberger, Global Product Management, HPE Security – Data Security.
Brian was first at the podium. Aerospike is a company providing what they claim is a very high speed, scalable database, proudly advertising “NoSQL!” The problem they have is that they are one of many companies still confused about the difference between databases and SQL. A database is not the access method. What they’re really focused on in loosely structured data, the same way Hadoop and other newer databases are aimed. That doesn’t obviate the need to communicate via SQL.
He also said that the operational in-memory market is “owned by NoSQL.” However, there were no numbers. Standard RDBMS’s, columnar and NoSQL databases all are providing in-memory storage and processing. In fact, Information Management has a slide show of Gartner’s database analytics vendor report and you can see the breadth there. In addition, what I constantly hear (not statistically significant either…) is that Hadoop and other loosely-structured databases are still primarily for batch. However, as the slide show I just mentioned is in alphabetical order, and Aerospike is the first one you’ll see. Note again that I’m pointing out flaws in the marketing message, not the products. They could have a great in-memory solution, but that’s doesn’t mean NoSQL is the only NoSQL option.
The final key marketing issue is that he kept misusing “transactional.” He continued to talk about RDMS’s as transactional systems even while he talked about the power of Aerospike for better handling the transactions. In the later portion of his presentation, he was trying to say that RDBMS’s still had a place, but he was using the wrong term.
Attunity’s Kevin Petrie was second and his focus was on Attunity Replicate. The team of Aerospike and Attunity again shows the market isn’t yet mature enough to have ETL and databases come smoothly together. Kevin talked about their 35 sources and it seem that they are the front end in the marketing paring of the two companies. If you really need heterogeneous data sources and large database manipulation, you’ll need to look at the pair of companies.
My key issue with this section was one of enterprise priorities. Perhaps the one big, anonymous reference they both discussed drove the webinar, but it shouldn’t have owned the message. Mr. Petrie spent almost all his time talking about Hadoop, MongoDB and Kafka. Those are still bleeding edge tools while enterprise adoption requires a focus on integrating with standard and existing sources. Only at the end, his third anonymous case, did Kevin have a slide that mentioned RDBMS sources. If he wants to keep talking with people running experimental and leading edge tests of systems, that priority makes sense. If he wishes to talk to the larger enterprise market, he needs to turn things around.
The other issue was a slide that equated RDBMS, Data Warehouse and Hadoop as being on equal footing. There he shows a lack of business knowledge. The EDW, as an old TV would declare, is the one of these things that is not like the other. It has a very different purpose from the two database technologies and isn’t technology dependent.
Reiner Kappenberger gave a great presentation but it didn’t belong. It seems the smaller two firms were happy to get HP to help with the financing but they didn’t think about staying on message.
Let me make it very clear: Security is of critical importance. What Mr. Kappenberger had to say was very important for people to hear. However, it didn’t belong in this webinar. The topic didn’t fit and working to stuff three presenters into forty minutes is always tough. Another presentation where all three talked about how they work to ensure that the large volumes of data can be secure at multiple levels would have been great to hear – and I hope the three choose to create such a webinar.
This was two different webinars stuffed into one, blurring the message. In addition, Aerospike and Affinity either need to make sure they they’re not yet trying to address the mass market or they need to learn how to stop speaking to each other and other leading edge people and begin to better address the wider enterprise market.
The unnamed reference seemed to be a company that needed help with credit card transactions and fraud detection, and all three companies worked to provide a full solution. However, from a marketing standpoint I don’t think they did proper service to their project by this webinar.
Read my article in the latest TDWI journal.
My latest Tech Target article is up at http://searchdatamanagement.techtarget.com/tip/SQL-vs-NoSQL-database-design-debate-isnt-even-a-real-fight.
This week’s TDWI hosted webinar was about engaging business and, once again, it came from the standpoint of technologists rather than from business. There were some very good things said. However, until our industry stops thinking of business knowledge workers as children to be tutored and begins to think about them as people whose knowledge is the core of what we must encapsulate, we’ll continue to miss the mark and adoption of solutions will remain slow.
The main presenter was David Loshin, President of Knowledge Integrity. He began the presentation with a slide that describes his view of the definition of “data driven,” including three main points:
We should all clearly understand that the first item is not new and was not created by the business intelligence (BI) industry. Business has always been data driven. What we’re able to do now is access far more data than ever before so that we can provide a more robust view of the corporation.
The second bullet is a core point. Mr. Loshin used a couple of example such as sales territory and other areas where definitions are fuzzy. One clear difference to me is one I directly experienced 25 years ago, and more directly addresses the visualization side of the BI conundrum. I was working for a major systems integrator (SI) and my client was, well, let’s just say it was a large, fruit based computing company.
A different SI had created an inventory system for the client’s manufacturing facility but the system was a failure though all the right data was in the system. The problem was that the reports were great for the accounting department, not for inventory and manufacturing. We interviewed the inventory team and then rewrote reports to address and present the information from their standpoint.
Too often, technologists get lost in the detailed data definitions and matching fields across data sources. That is critical, but it loses the big picture. Even when data is matched, different business people use data differently.
Which brings us to David Loshin’s third point. No, we don’t need to enforce exact standards for utilization. We need to ensure that the data each consumer refers to is consistent, but we must do a better job in understanding that different departments can utilize the exact same data in a variety of ways.
David did get to the key issue a bit later, on a slide titled Operationalizing Business Policies. He points out that it’s critical to ensure that “Information policies model the data requirements for business policy.” This is key and should be bubbled up higher in the mindset of our industry. While I hear it mentioned often, it seems to be honored more in the breach.
Time was spent discussing the importance of understanding different users and their varying utilization of data. As I mentioned in the introduction, the solution to the new complexities then veers from addressing business needs to ignoring history. In a previous blog post, I discussed how many in the industry seem to be ignoring the lessons to be learned from the advent of the PC. Mr. Loshin seems to be doing that when he talks about empowering the business users to set their own usability rules. He splits IT and business in the following way:
The issue I have with that argument is a phrase that didn’t appear in this webinar until Linda Briggs, the moderator, mentioned it in a poll question right before Q&A: Data Governance. Corporations are increasingly liable for how they control and manage information. It does not make sense to allow each user to define their own data needs in a void. Rather than allow for massively expanded and relatively uncontrolled access to data and then later have to contract access, as corporations had to regain a handle on what was being done on scattered desktop computers, BI vendors should be positioning data governance from the start.
Whether it’s by executive fiat, a cross-functional team, or some other method, companies need to clarify data governance rules. Often, IT is the best intermediary between groups, actively participating in data governance definition as an impartial observer and facilitator. It is then the job of IT to ensure that it provides as open access as possible to business workers given their needs and the necessity of following governance rules.
There was one question, during Q&A, on the importance of data governance. I thought David Loshin again understated its importance while Harald Smith, Director of Product Management at Trillium, the webinar sponsor, had the comment that “everyone is responsible for data governance.” That is my only mention of the sponsor, as I felt his portion of the presentation was a recitation of sound bites, talking points and buzz words that didn’t provide any value to the hour.
David Loshin has a clear view of engaging the business and gets a number of key things correct. However, that view is one of a technologist looking over a self-imagined bridge separating technology and business. There’s not a bridge separating IT and business. They overlap in many critical areas and both must learn from and work well with each other.
The launch of Yellowfin DashXML included a round of global webinars mid-week. Well, not “included,” it’s more that the webinar was the entire launch. The new product feature is useful, but as I’m a marketing person I do have to question how they’ve handles the launch.
Yellowfin, as with many business intelligence (BI) vendors, is focused on visualization, providing business knowledge workers the ability to easily see information. The presentation was by John Ryan, Director of Product Marketing, and Teresa Pringle, Product Specialist. As is obvious from the title of the webinar, it was to announce the availability of the first version of DashXML, a utility within Yellowfin that allows easy integration of custom XML into dashboards and reports.
While they do sell directly to IT organizations who provide their interface to their corporate users, they also have a strong OEM business. As Mr. Ryan pointed out, “Embedding BI is a large chunk of Yellowfin’s business.” While direct label clients also want to customize user interfaces, DashXML seems much more valuable to the OEM customer base, providing an easier way to integrate standards from existing applications in order to have a more consistent interface.
The key word in that last sentence was “easier,” not “easy,” and that’s just fine for what is needed. This is XML. As Ms. Pringle explained, programmers will need to be very familiar with CSS manipulation and also with Java Script. DashXML is there to assist developers in providing customized visualizations, it is not for end users. The feature is available with a server license, providing deployment capability, and with a developer license for investigating the feature. It is not available as part of the per-user, distribution license for end users.
DashXML adds power and flexibility to Yellowfin’s offering and will better help its clients customize visualizations.
As much as the presenters seemed to be working to imply DashXML is a new product, it’s really a feature of their platform. While the title of the webinar was a launch, nothing in the presentation or on their site implies it’s really a launch.
Almost the entire presentation was about the existing Yellowfin offering. Teresa Pringle’s “demo” portion of the webinar started with a whole lot of customized interfaces and only spent a few minutes showing the DashXML features in design and only for a single report in a dashboard. You could get the idea that it would make things easier, but it was also clear that’s all it did. There’s nothing really new, nothing that Yellowfin clients aren’t doing now, it’s a way to save time and money. Mind you, those are very valuable things, but the presentation didn’t focus on any ROI those savings might present.
What’s more intriguing is that they held a webinar, yet their site doesn’t reflect that knowledge. As of the writing of this blog entry (24 hours after the webinar), a few things seem to be missing:
If the feature isn’t important enough to discuss on the web site, why have a webinar? After all, the purpose of a webinar is to drive interest in the product and one of the key follow ups for webinars should also be gaining information on your site to hopefully drive customer tracking and contact information as lead qualification.
DashXML is a nice addition that can help IT and OEM developers blend point-and-click development and coding to provide a customized visualization interfaces with better ROI. However, a week webinar and no content is neither a silent launch nor a strong one. Sadly, the marketing doesn’t rise to the quality of the product enhancement.
TDWI held a webinar to announce their latest major report. While there are always a lot of intriguing numbers in the reports, it’s also important to remember the TDWI audience is self-selecting. People interested in the latest information lean towards the leading edge so their numbers should be taken as higher than would be in the general IT market place. Still, the numbers as they change over time are valuable and the views of the analysts are often worth hearing.
As the webinar was pushing a major report, the full tag team was in attendance: David Stodder, TDWI Director for BI, Fern Halper, TDWI Director for Analytics, and Philip Russom, TDWI Director for Data Management.
David Stodder presented his section first, and one important point he made had nothing to do with numbers. He briefly discussed one quote and user story and it was from a government employee. Companies using Hadoop to better understand internet business and relationships tend to get almost all the press, but David pointed out the importance of data and analytics in helping governments better address the needs of their citizens.
A very intriguing set of numbers David provided was on how many responders were on current versions of software versus older versions. While you can see that some areas are more quickly adopting the SaaS model, that’s not the key the he pointed out. Only 27% of respondents said they’re on the current version of their data security software. A later slide shows that security is one reason for hesitation in the move to mobile, but Mr. Stodder rightly points out that underlying all the information channels is the basis of data security. It’s not a question of if you’ll get hacked but when, so data security should be kept updated.
The presentation was then turned over to Fern Halper. I look a bit askance at the claim that the Internet of Things (IoT) is a “trend.” Her data shows only 18% taking advantage of it today and 40% might be using in within three years. We’ve been talking about IoT for a while, and it’s clearly being slowly integrated into business, I wouldn’t say it’s as fashionable as the word trend would imply.
On the more useful side is the table she showed that’s simply titles “Analytics hits mainstream.” It not only shows that massive adoption of the last decade’s focus on dashboards and BI tools, but around 30% of respondents are using many of the newer tools and techniques and the next three years indicate a doubling in usage.
Philip Russom gave the final segment of the presentation. His first slide on the adoption of newer technologies for data warehousing showed something that many have finally admitted in the last year or no: No-SQL is an excuse made by people who don’t understand how business technology works. While the numbers show 28% of respondents using Hadoop, it also shows 22% using SQL on Hadoop. The number over the next three years are even more interesting: 36% say they’ll be using Hadoop and 38% will be using SQL on Hadoop. That means existing No-SQL folks will be moving to SQL.
The presentation ended with the team of analysts presenting their list of ten priorities for those people interested in emerging technologies. To me, the first isn’t the first among equals, it is set far above all the rest: Adopt them for their business benefits. All the other nine items are how IT addresses the challenges of new technologies, but those things are useless unless you understand how technologies will support business. Without that, you can’t provide an ROI and you can’t get business stakeholders to support you for long. That’s strategy, all the other points are just tactics.
As usual, get the report and browse it.
A recent presentation by IBM at the BBBT was interesting. As usual, it was more interesting to me for the business information than the details. As unusual, they did a great job in a balanced presentation covering both. While many presentations lean too heavily in one direction or the other, this one covered both sides very well.
The main presenter was Harriet Fryman, VP of Marketing, IBM Analytics Platform. Adding information during the presentation were Steven Sit, Director of Product Management, Open Source Based Analytics Systems, and Steve Beier, Program Director, Spark Technology Center.
The focus of the talk was IBM’s commitment to Apache Spark. Before diving deep into the support, Ms. Fryman began by talking about business’ evolving data needs. Her key point is that “we all do data hording,” that modern technologies are allowing us to horde far more data than ever before, and that better ways are needed to get value out of the data.
She then proceeded to define three key aspects of the growth in analytics:
The second two overlap, as the ability to analyze large volumes of data in near real-time means a need to have systems do more analysis. The following slide also added to IBM’s picture of the changing focus on higher level information and analytics.
The presentation did go off on a tangent as some analysts overthought the differences in the different IBM groups for analytics and for Watson. Harriet showed great patience in saying they overlap, different people start with different things and internal organizational structures don’t impact IBM’s ability to leverage both.
The focus then turned back to Spark, which IBM sees as the unifying layer for data access. One key issue related to that is the Spark v Hadoop debate. Some people seem to think that Spark will replace Hadoop, but the IBM team expressed clear disagreement. Spark is access while Hadoop is one data structure. While Hadoop can allow for direct batch processing of large jobs, using Spark on top of Hadoop allows much more real time processing of the information that Hadoop appropriately contains.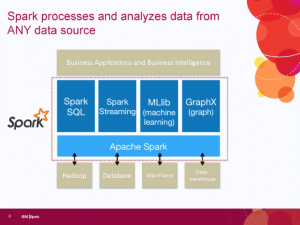
One thing on the slide that wasn’t mentioned but links up with messages from other firms, messages which I’ve supported, is that one key component, in the upper left hand corner of the slide, is Spark SQL. Early Hadoop players were talking about no-SQL, but people are continuing to accept that SQL isn’t going anywhere.
Well, most people. At least fifteen minutes after this slide was presented, an attending analyst asked about why IBM’s description of Spark seemed to be similar to the way they talk about SQL. All three IBM’ers quickly popped up with the clear fact that the same concepts drive both.
While the team continued to discuss Spark as a key business imitative, Claudia Imhoff asked a key question on the minds of anyone who noticed huge IBM going to open source: What’s in it for them? Harriet Fryman responded that IBM sees the future of Spark and to leverage it properly for its own business it needed to be part of the community, hence moving SystemML to open source. Spark may be open source, but the breadth and skills of IBM mean that value added applications can be layered on top of it to continue the revenue stream.
Much more detail was then stated and demonstrated about Spark, but I’ll leave that to the more technical analysts and vendor who can help you.
One final note put here so it didn’t distract from the main message or clutter the summary. Harriet, please. You’re a great expert and a top marketing person. However, when you say “premise” instead of “premises,” as you did multiple times, it distracts greatly from making a clear marking message about the cloud.
IBM sees the future of data access to be Apache Spark. Its analytics group is making strides to open not only align with open source, but to be an involved player to help the evolution of Spark’s data access. To ignore IBM’s combined strength in understanding enterprise business, software and services is to not understand that it is a major player in some of the key big data changes happening today. The IBM Spark initiative isn’t a marketing ploy, it’s real. The presentation showed a combination of clear business thought and strategy alongside strong technical implementation.
I just saw an amusing presentation by SAS. Amusing because you rarely get two presenters who are both as good at presenting and as knowledgeable about their products. We heard from Mike Frost, Senior Product Manager for Data Management, and Wayne Thompson, Chief Data Scientist. They enjoy what they do and it was contagious.
It was also interesting from the perspective of time. Too many younger folks think if a firm has been around for more than five years, it’s a dinosaur. That’s usually a mistake, but the view lives on. SAS was founded almost 40 years ago, in 1976, and has always focused on analytics. They have been historically aimed at a market that is made up of serious mathematicians doing heavy statistical work. They’re very good at what they do.
The business analysis sector has been focused on less technical, higher level business number crunching and data visualization. In the last decade, computing power has meant firms can dig deeper and can start to provide analysis SAS has been doing for decades. The question is whether or not SAS can rise to the challenge. It’s still early, but the answer seems to be a qualified but strong “yes!”
Both for good and bad, SAS is the largest privately held software company, still driven by founder James Goodnight. That means a good thing in that technically focused folks plow 23% of their revenue into R&D. However, it also leaves a question mark. I’ve worked for other firms long run by founders, one a 25+ year old firm still run by brothers. The best way to refer to the risk is that of a famous public failure: Xerox and the PC. For those who might not understand what I’m saying, read “Fumbling the Future” by Smith and Alexander. The risk comes down to the people in charge knowing the company needs to change but being emotionally wedded to what’s worked for so long.
The presentation to the BBBT shows that, while it’s still early in the change, SAS seems to be mostly avoiding that risk. They’re moving towards a clean, easier to use UI and taking their first steps towards collaboration. More work needs to be done on both fronts, but Mike and Wayne were very open and honest about their understanding the need and SAS continuing to move forward.
One of the key points by Mike Frost is one I’ve also discussed. While they disagree with me and think the data scientist does exist, the SAS message is clear that he doesn’t work in a void. The statistician, the business analyst and business management must all work in concert to match technical solutions to real business information needs.
The focus of the presentation was on SAS LASR, their in-memory analytics server. While it leverages Hadoop, it doesn’t use MapReduce because that involves disk access during processing, losing the speed advantage of in-memory applications.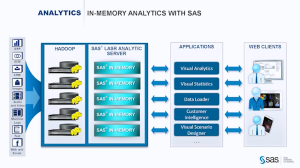
As Mike Frost pointed out, “It doesn’t do any good to run the right model too late.”
One point that still shows the need to think more about business, is that TCO was mentioned in passing. No slide or strong message supported the message. They’re still a bit too focused on technology, not what sells the business decision makers on business intelligence (BI).
Another issue was the large number of ancillary products in the suite, including Visual Data Explorer, Data Loader and others. The team mentioned that SAS is slowly moving through the products to give them the same interface, but I also hope they’re looking at integrating as much as possible so the users don’t have the annoyance of constantly moving between products.
One nice part of the demo was an example of discussing what SAS has termed “poorly structured data” as opposed to “unstructured data” that’s the rage in Hadoop. I prefer “loosely structured data.” Mike and Wayne showed the ability to parse the incoming file and have machine intelligence make an initial pass at suggesting fields. While this isn’t new, I worked at a company in 2000 that was doing that, it’s a key part of quickly integrating such data into the business environment. The company I reference had another founder who became involved in other things and it died. While I’m surprised it took firms so long to latch onto and use the technology, it doesn’t surprise me that SAS is one of the first to openly push this.
Another advantage brought by an older, global firm, related to the parsing is that it works in multiple languages, including right-to-left languages such as Hebrew and Arabic. Most startups focus on their own national language and it can be a while before the applications are truly global. SAS already knows the importance and supports the need.
The only big marketing mistake I heard was towards the end. While Frost and Thompson are rightfully proud of their products, Wayne Thompson crowed that “We’re not XXX,” a reference to a major BI player, “We’re end-to-end.” However, they’d showed only minimal visualization choices and their collaboration, admittedly isn’t there.
Even worse for the message, only a few minutes later, based on a question, one of the presenters shows how you export predicted values so that visualization tools with more power can help display the information to business management.
I have yet to see a real end-to-end tool and there’s no reason for SAS to push this iteration as more than it is. It’s great, but it’s not yet a complete solution.
SAS is making a strong push into the front end of analytics and business intelligence. They are busy wrapping tools around their statistical engines that will allow them to move much more strongly out of academics and the very technical depths of life sciences, manufacturing, defense and other industries to challenge in the realm of BI.
They’re headed in the right direction, but the risk mentioned at the start remains. Will they keep focused on this growing market and the changes it requires, or will that large R&D expenditure focus on the existing strengths and make the BI transition too slow? I’m seeing all the right signs, they just need to stay on track.