Author Archives: David Teich

TDWI / Actuate Webinar on Visualization: Not much there

Maybe it’s because of the TDWI conference now going on in San Diego, but this morning’s webinar on “Making Data Beautiful for Business Users” seemed a bit of an afterthought. The presenters were Dave Stodder, TDWI Director of Research, and Allen Bonde, VP Product Marketing and Innovation, Actuate. There were a few interesting moments, but not a lot of even basic content.

Dave Stodder began with a whole bunch of quotes from other people. I admit, it’s a quick way to put together a presentation, but then you should paraphrase and explain why the quotes matter rather than just reading them verbatim – we, the audience, are already doing that.

However, then he got to the three main goals of improving visualization in BI:

  • Improving self-service
  • Shortening the path to insight
  • Advancing business agility

To be honest, those are accurate but also valid for every other point in reporting throughout history. Businesses always want to enable decision makers to help make more accurate and timely decisions through better information.

What followed was one of the keys to TDWI success: An interesting slide based on one of their surveys.TDWI Visualization ROI Focus slide
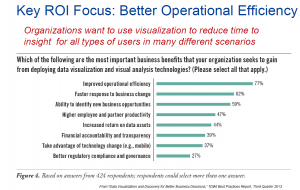
Improved operational efficiency was a clear number one. The problem is that the data is most likely from IT respondents rather than from business users. I asked the question about that but it wasn’t answered. I predict that if you asked business users you’d find the second two items, faster response and identify new opportunities, would be at the top.

One important point Dave Stodder made was about alert fatigue. It’s tempting to have visualizations and other tactics that alert anytime things change, but too many alerts mean people stop paying attention. It reminded me of my days as a sales engineer, back in the days of pagers. Another SE and I had to sit down one of the sales people and explain that if he appended 911 to every page then nothing was important.

The only part purely focused on visualizations were two slides. One was just a collection of a few visualization types and the other was another TDWI survey about which visualization types are currently being implemented. There wasn’t a discussion of the appropriateness of the ones being used the most, any reason to better focus on some being ignored, or any discussion about how many are provided by packaged BI tools versus are home grown by the supposedly valuable data scientists.

Allen Bonde then took over and didn’t focus on visualization. He gave a rather generic Actuate sales pitch, mentioning platforms built for scale, the importance of an open community and didn’t show any visuals on visualization.

It wasn’t that the presentation was terrible, it’s only that it was far too generic. What was said about visualizations could be said about just about any reporting and there wasn’t really any direct focus on visualization. It’s one thing to quote Tufte, it’s another to have a discussion about current tools and what’s coming. That later was missed.

Maybe after the conference we’ll see another webinar with clearer focus.
SQL v Hadoop: The Wrong Conversation

“No SQL!”

“Hadoop doesn’t require you to work in SQL!”

The claims are everywhere, but do they mean anything? To ruin the suspense: No.

There seems to be a big misunderstanding or a big lack of communications in the realm of big data. I keep hearing company after company compare Hadoop to SQL, claiming the former is somehow better than the later. Sadly, that’s comparing apples to screwdrivers.

Hadoop is a database technology. It’s based on MPP architecture for the Cloud. Hadoop compares to flat files, relational databases and other methods for storing information in structures.

SQL is an query language. It’s similar to an API in that it’s just a way to communicate with the data source. Long ago, in the dawn of time, SQL was tightly tied to DB2 and the relational environment that spawned the syntax. However, along came the 1980s, Unix servers and PCs, and the need to access lots of different data sources and an unwillingness to have to have very separate query languages for each data source.

Along came ODBC to the rescue. It standardized core query syntax using the SQL paradigm and allowed, under the covers, the ODBC developer to use an API to translate almost standard queries into the language of each data source. It extended SQL to access new things.

In the meantime, as RDBMS technologies began to try to find ways around the basic limitations of relational databases, the companies added extra features such as stored procedures that extended SQL even further from the origins of basic definition and query of relational structures.

So now we have a mass of coders who have only worked with large, primarily Web oriented databases using non-RDBMS technology. No surprise, they had to code their own interfaces and queries, getting into the details of the newer systems. At the same time, they probably brushed through and overview of RDBMS and SQL in school and then never used it again.

That meant a misunderstanding of the difference between database and query. Therefore, the message of No SQL will retard their progress in integrating their solutions with the existing IT data infrastructure.

There’s a large need for people who can work with Hadoop and other younger data sources. There’s also a vast pool of people who know SQL. Yes, there will always be a need for Hadoop gurus just as there is for every technology, but the folks wanting to get information out of data sources don’t need to know the data sources, they need to get the information – and they know SQL.

A number of vendors have figured that out and are now offering SQL as a means to access Hadoop. It’s a natural fit, an extension of what the people pushing Hadoop are hoping to achieve. Hadoop and other distributed, non-row based architectures are there to expand knowledge. They’re great ways to better understand the vast body of data coming in from many new sources. However, until you can get that data to the business knowledge worker, it’s not information. SQL is the clearest way to quickly bridge that gap.

The people who realize that it’s not an either/or decision, who understand that Hadoop and SQL not only can but should work together are the people who will drive their companies forward by quickly addressing real business needs.

SQL v Hadoop is the wrong conversation. SQL and Hadoop is the right one.

Webinar: IBM, Actuate and Cirro describe faster analytics

Today a webinar was hosted by Database Trend and Applications. While there are important things to talk about, I’ll start with the amusing point of the inverse relationship between company size and presenter title found in every webinar, but wonderfully on display here. The three presenters were:

  • Mark Theissen, CEO, Cirro
  • Peter Hoopes, VP/GM, BIRT Analytics Division, Actuate
  • Amit Patel, Program Director, Data Warehouse Solutions Marketing, IBM

The topic was “Accelerating your Analytics for Faster Insights.” That is a lot to cover in less than an hour, made more brief by a tag team of three people from different companies. I must say I was pleasantly surprised with how well they integrated their messages.

Mark Theissen was up first. There were a lot of fancy names for what Cirro does, but think ETL as it’s much easier. Mark’s point is that no single repository can handle all enterprise data even if that made sense. Cirro’s goal is to provide on-demand distributed analytics, using federation to link multiple data sources in order to help businesses analyze more complete information. It’s a strong point people have forgotten in the last few years during the typical “the latest craze will solve everything” focus on Hadoop and minimizing the role of getting to multiple sources.

Peter Hoopes then followed to talk about doing the analytics. One phrase he used should be discussed in more detail: “speed wins.” So many people are focused on the admittedly important area of immediate retail feedback on the web and with mobile devices. There, yes, speed can win. However, not always. Sometimes though helps too. That’s one reason why complex analysis for high level business strategy and planning is different that putting an ad on a phone as you walk by a store. There are clear reasons for speed, even in analytics, but it should not be the only focus in a BI decision.

IBM’s Amit Patel then came on to discuss the meat of the matter: DB2 Blu. This is IBM’s foray into in-memory, columnar databases. It’s a critical ad to the product line. There are advantages to in-memory that have created a need for all major players to have an offering, and IBM does the “me too!” well; but how does IBM differentiate itself?

As someone who understands the need for integration of transaction and analytic systems and agrees both need to co-exist, I was intrigued by what Amit had to say. Transactions going into normal DB2 environment while being shadowed into columnar BLU environment to speed analytics. Think about it: Transactions can still be managed with the row-oriented technologies best suited for them while the information is, in parallel, moved to the analytics database that happens to be in memory. It seems to be a good way to begin to blend the technologies and let each do what works best.

For a slightly techhie comment, I did like what Mr. Patel was saying about IBM’s management of memory and CPU. After all, while IBM is one of the largest software vendors in the world, too many folks forget their hardware background. One quick mention in a sentence about “hardware vendors such as Intel and IBM…” was a great touch to add a message that can help IBM differentiate its knowledge of MPP from that of pure software companies. As a marketing guy, I smiled big time at the smooth way that was brought up.

Summary

The three presenters did a good job in pointing out that the heterogeneous nature of enterprise data isn’t going away, rather it’s expanding. Each company, in its own way, put forward how it helps address that complexity. Still, it takes three companies.

As the BI market continues to mature, the companies who manage to combine the enterprise information supply chain components most smoothly will succeed. Right now, there’s a message being presented by three players. Other competitors also partner for ETL, data storage and analytics. It sounds interesting, but the market’s still young. Look for more robust messages from single vendors to evolve.

IDC says business analytics an 89.6 billion (USD) market by 2018

For those who might have missed it, IDC published a press release last week pointing to strong growth in business analytics. That’s going to keep a lot of companies busy, good or not, but results will begin to weed out a number of them. A lot of companies, established and startup, are making a lot of promises to meet that demand but not all will do the right things.

I think we’ll see a shake-out begin to happen in the next 2-3 years, even with the demand.

HP Vertica at the BBBT: Technology v Solution

The latest BBBT presentation was from HP Vertica’s Will Cairns and Steve Sarsfield. I know it’s hard to miss HP’s presence in any market, but for those few of you who may have done so HP acquired Vertica in early 2011. Vertica is a columnar database focused on large data sources for analytics. Will and Steve were a good tag team, switching back and forth as need be; so unlike other presentation reviews I will rarely be noting who said what.

The smallest installation they mentioned runs on HP Vertica is 1.5 terabytes up to very large ones such as at Facebook, their largest customer. Without a doubt, HP plays at the larger end of the analytics market. They have a strong and powerful database and it seems HP’s hardware experience and Vertica’s database knowledge seems to have been integrated far better than other HP acquisitions in the previous decade.

The problem I often come back to discuss, whether talking about a startup or a company such as HP, is the issue of technical problems versus business solutions.

Will Cairns did say one thing that should be paid attention to by many who talk about unstructured data. His very accurate point is that “unstructured data doesn’t stay unstructured long.” We talk about conversations as unstructured, but to get information from those, we must part the syntax of sentences, look for key words and meaning, and extract semantics with meaning. Those items can then be similarly structured in order to compare, analyze and draw conclusions.

However, the weak spot in his eyes is his title. He constantly referred to “supporting data scientists” rather than supporting data science. As the programmers who know statistics create more and more packages that can analyze data, it’s the analytical capabilities being provided to business people that matters, not the people who call themselves data scientists who also just exist to serve the end business use.

One interesting techie note about their MPP database is that there isn’t an automatic lead node. While there’s no independent analysis for intelligence allocation of notes other than, it seems, basic load balancing, the idea that you can automatically define a lead node based on balancing, not before, does imply a good ability to manage distributed resources.

One thing I’ve asked a few folks who push columnar databases came up again in this presentation. They were talking about something called projections, which seemed to be ways to index the data for faster access. However, they claimed it’s not indexing but gave no clear explanation.

I then asked the question that always intrigues me. It’s clear that columnar databases have a great strength in analytics across records because indexes aren’t needed for columns, but it’s clear that both row and column based analyses have value, so getting a clearer picture how any database supports both would seem to be important. I pointed out that indexes in row-based databases exist to allow faster search of columns. The question is: What techniques are used to speed up row based searches in columnar databases if no indexes exist. They didn’t have an answer.

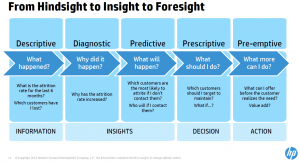
One slide that created a great conversation was one of the types of analytics and their definitions. Claudia Imhoff and others questioned the difference between predictive, prescriptive and pre-emptive analytics. While better clarity is definitely needed, the attempt is a great conversation starter for the industry.

HP Vertica - Hindsight to Foresight slide

Summary

HP Vertica seems to be a database that should be evaluated for large data volume analytics. However, they seem to have a focus on the technology not on why companies want the technology. There was no real discussion of results, or of partnerships with BI vendors to provide end user value. I expect that successful sales won’t be purely HP. They are focused purely on IT and programmers who are building very complex algorithms. They’ll need either a channel or ISV partner to round out the picture to an enterprise who needs to see the full business value chain.

It seems to be a very strong product, but only part of the solution.

TDWI, Claudia Imhoff and SAP: Data Architecture Matters

In a busy week for TDWI webinars, today’s presentation by Claudia Imhoff, Intelligent Solutions, and Lother Henkes, SAP, was about how the continuing discussion of the place in the data world for the data warehouse.

While many younger techies think the latest technology is a panacea and many older techies are far too skeptical for too long, the reality is that while the data warehouse is going nowhere, it has to integrate with the newer technologies to continue improving the information being provided to business knowledge workers.

One of Claudia’s early slides talked about data sources. While most people are focused on both the standard packaged software and the rush of non-structured data from the Web, call centers, etc, Claudia makes clear the item that companies are just beginning to realize and address: Sensor data is just as important as the rest and also driving data volumes. Business information continues to come from further afield and a wider variety of sources and all must be integrated.

Much of her talk, she mentioned, has come out of a couple of years of work between herself and Colin White, in formalizing the changing data architecture environment. Data warehouses are still the place for production reports and analytics, where data provenance and clarity are absolutely necessary while the techniques used on early stage data such as in streaming, Hadoop analytics, etc, are more exploratory and investigative. The duo posit that the combination of data integration, data management (including EDWs), data analysis and decision management are the “glue in the middle,” those things that bind sources, deployment and distribution technologies, and reporting and analytics options into a real system that provides value.

The picture they put together is good and Claudia Imhoff’s presentation should be looked at for a better understanding of where we are; but I wouldn’t be me if I didn’t have a couple of issues.

The first is a that she is a bit too enamored of mobile technology. It’s here and must be addressed, but statements such as “nobody has a desktop, everything is mobile” must be corrected. A JD Power survey last year showed that only 20% of tablets are used for work. On the other side, Forrester Research has pointed out a strong majority of business people are now using two devices for their information.

The issue for business intelligence is not that people are switching from desktops (including laptops in docking stations) but that smart providers of information need to build UIs that address the needs of large monitors, tablets and smartphones, addressing each device’s uniqueness while ensuring a similarity of user experience.

The second issue is a new term thrown out during the presentation. It’s “data refinery” and, as Claudia mentioned in her presentation, it’s the same thing others are calling a data swamp, data lake or numerous other terms. There’s an easy term everyone has used for years: Operational Data Store (ODS). I’m a marketing guy and I understand the urge for everyone to try to coin a term that will catch on, but it’s not needed in this case.

While it’s a separate topic (yeah, another concept for a column!), I’ll briefly point out my objections here. Even back in the late 1990s, during my brief sojourn at Informatica, we were talking about how the ODS can be used for more than only a place to use in order to quickly extract information from operational system so as not to stress them by doing transformations directly from such systems. They’ve always been a place to take an initial look at data before beginning transformations into star schemas and the like. The ODS hasn’t changed. What’s changed is the underlying technologies that support larger data stores and the higher level analytics that let us better analyze what’s in the ODS.

That brings us to one main point Claudia Imhoff made during her wrap-up, the section on business considerations. She points out that people really need to understand the importance of each data source and the data within it. Just because we can extract everything doesn’t mean we need to save everything. Her example was with customer sampling. Yes, you can get all the customer data, but only that which you need to narrow cast. For higher level decision making, those who understand confidence levels know that sampling can get to very high levels of certainty so sampling can still speed decision making and save costs. Disk space might be less expensive in the Cloud, but it’s not free. We’re in the job of helping businesses improve themselves, so we need to look at the bigger picture.

Her presentation was clearly strategic: We need to rethink, not reinvent, data modeling. Traditional techniques aren’t going away and neither are many of the new ones. Data management people need to understand how they combine.

No surprise, that was a great transition to Lother Henkes’ presentation. His key point is that SAP BW now can run on SAP HANA. It’s important even if all the capital letters look like shouting. HANA is SAP’s in memory, columnar database that’s their entry into the Cloud market to manage the high volumes of modern data. It’s a move to bridge the gap between the ODS and relational database arenas with one underlying infrastructure.

In such a brief webinar, it’s hard to see more than the theory, but it’s a clear move by SAP to do what Claudia Imhoff suggested, to take a fresh look at data models in order to understand how to better support the full range of data now being incorporated into business decision making.

TDWI & Teradata: Data Management Best Practices in the Age of Big Data and Real-Time Operations

Today’s TDWI presentation (And they’ve crammed a number of webinars into this week) was led by Philip Russom, TDWI Research Director, and sponsored by Teradata. While the name of the topic was clearly a push to market their best practices report series, I have to say that this presentation was about both higher and lower level concepts than best practices, not that that’s a bad thing.

The one clear thing was the point made by Philip at the beginning. Given the title, this was a presentation aimed clearly at IT and data management issues. Considering my comments on Teradata’s presentation to the BBBT and about previous TDWI webinars, that’s a comfort zone for both organizations. They don’t understand business users of technology as well as they understand the people creating the infrastructure.

As usual, TDWI bases their discussions on the results of the vast number of very interesting surveys that are the basis of their research. The first set of numbers of interest today was the response to a question on what technical issues are pushing change. The need for analytics edged out data volumes for the top spot. That’s the one clear indication that business users are driving IT spending and should be focused on a bit more closely.

One key point made by Mr. Russom was that one of the key questions asked by knowledge workers to IT is always “Where did this data come from?” Data governance matters, even during the rush to focus on rapid analytics. He came back to the point multiple times in the presentation and it’s important for more people in IT to realize that the techniques and technologies falling in the weird category of Big Data won’t become mainstream until data governance is competently addressed by vendors.

A Sidebar on Reports v Analytics

One problem I have with the presentation, and with many of the folks discussing the new types of analytics is they create an artificial wall between reports and analytics. Philip gave an example of fraud protection and how reports would cleanse the data, hiding both the positive and negative connotations of outliers. Well, not quite. Those of us who were programmers years ago, not academics or analysts, clearly remember that exception reporting was always critical.

New analytics techniques allow us to better manipulate the same data in more complex ways or larger data sets faster, but the goal of reporting and analysis is the same: To display information in a fashion that allows actions to be derived from useful information. For some information, a simple report is appropriate, in another a Paretto diagram might be better, but they’re both valuable and there’s nothing new about the intent of modern analytics.

True best practices looks at what’s the appropriate technique for delivering each type of information. Mr. Russom did, a few slides later, talk about older and newer techniques working together as in two decks of cards being shuffled together and I think that imagery is better than his words since the decks look a lot alike.

Back to the Presentation

Another thread that ran through Philip Russom’s presentation was the mention of broader data sources. This is a key point of mine that I’m figuring out how to better document and publish, but I’m not the only one. I’ve always had a problem with the phrase “Big Data.” Big is always relative and constantly changing, plus it’s more of a hardware issue. What’s new about current data management is that the number of sources are much more varied, unstructured data is taking a more prominent role, and IT must look at how best to access very heterogeneous sources and providing integration between them. A Russom points out, IT must be focused on breadth even more than volume.

That led to his final topic, and the perfect lead-in for Teradata, that Hadoop isn’t about to replace EDW’s but that IT needs to figure out how to ensure both co-exist and lend their strengths to cover each other’s weaknesses.

Chris Twogood then took over, focused on technology issues around Hadoop, JSON and other newer tools for managing data. Being a business person, I found the most interesting thing in Chris’ presentation to be a fly-by slide on the way to technology. Teradata defines the goal of data driven business as to “Achieve sustainable competitive advantage by leveraging insights from data to deliver greater value to their customers.” The only thing I’d do is shorten it, ending at “value.” After all, the customers aren’t the only stakeholders in a business. Better insight means better financial performance that can benefit owners and employees alike.

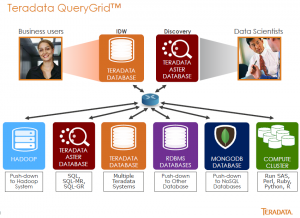
The presentation quickly moved along to Chris discuss the breadth of data means Teradata is working to provide access to all those sources. Teradata QueryGrid™ is their solution to provide an interface across data sources. Though I’m sure they’ll hate me for saying it, think of the product as ODBC on steroids.TDWI Teradata QueryGrid

From discussing that, Mr. Twogood then made a transition to making a claim that somehow the solution means they’re creating the “disruptive data warehouse.” I know that so many people in leading edge fields want to think they’re invention something glorious and new, but it just isn’t. This is an evolutionary change and not even a big one at that. What Teradata describes as disruptive is just the same concept as defined by the federated data warehouse concept discussed since the 1990s. Technology is finally advancing to be able to provide the actuality impossible to provide back then, but it’s just normal growth. That doesn’t make it any less powerful.

To emphasize that, one question during Q&A gave Philip Russom a great opportunity reinforce a few points by referring again, to data governance. He pointed out that the issues of data governance are the same for the EDW and Big Data. He also extended that by saying that good data management means you’re always trolling for new data sources. Big data isn’t the end, it’s just a part of the continuum and where we are now.

TDWI and IBM on Predictive Analytics: A Tale of Two Focii

Usually I’m more impressed with the TDWI half of a sponsored webinar than by the corporate presentation. Today, that wasn’t the case. The subject was supposed to be about predictive analytics, but the usually clear and focused Fern Halper, TDWI Research Director for Advanced Analytics, wasn’t at her best.

Let’s start with her definition of predictive analytics: “A statistical or data mining solution consisting of algorithms and techniques that can be used on both structured and unstructured data to determine outcomes.” Data mining uses statistical analysis so I’m not quite sure why that needs to be mentioned. However, the bigger problem is at the other end of the definition. Predictive analysis can’t determine outcomes but it can suggest likely outcomes. The word “determine” is much to forceful to honestly describe prediction.

Ms. Halper’s presentation also, disappointingly compared to her usual focus, was primarily off topic. It dealt with the basics of current business intelligence. There was useful information, such as her referring to Dave Stodder’s numbers showing that only 31% of surveyed folks say their businesses have BI accessible to more than half their employees. The industry is growing, but slowly.

Then, when first turning to predictive analytics, Fern showed results of a survey question about who would be building predictive analytics. As she also mentioned it was a survey of people already doing it, there’s no surprise that business analysts and statisticians, the people doing it now, were the folks they felt would continue to do it. However, as the BI vendors including better analytics and other UI tools, it’s clear that predictive analytics will slowly move into the hands of the business knowledge worker just as other types of reporting have.

The key point of interest in her section of the presentation was the same I’ve been hearing from more and more vendors in recent months: The final admission that, yes, there are two different categories of folks using BI. There are the technical folks creating the links to sources, complex algorithms and reports and such, and there are the consumers, the business people who might build simple reports and tweak others but whose primary goal is to be able to make better business decisions.

This is where we turn to David Clement, Product Marketing Manager, BI & Predictive Analytics, IBM, the second presenter.

One of the first things out of the gate was that IBM doesn’t talk about predictive analytics but about forward looking business intelligence. While the first thought might be that we really don’t need yet another term, another way to build a new acronym, the phrase has some interesting meaning. It’s no surprise that a new industry where most companies are run by techies focused on technology, the analytics are the focus. However, why do analytics? This isn’t new. Companies don’t look at historic data for purely nostalgic reasons. Managers have always tried to make predictions based on history in order to better future performance. IBM’s turn of phrase puts the emphasis on forward looking, not how that forward look is aided.

The middle of his presentation was the typical dog and pony show with canned videos to show SPSS and IBM Cognos working together to provide forecasting. As with most demos, I didn’t really care.

What was interesting was the case study they discussed, apparel designer Elie Tahari. It’s a case study that should be studied by any retail company looking at predictive analytics as a 30% reduction of logistics costs is an eye catcher. What wasn’t clear is if that amount was from a starting point of zero BI or just adding predictive analytics on top of existing information.

What is clear is that IBM, a dinosaur in the eyes of most people in Silicon Valley and Boston, understands that businesses want BI and predictive analytics not because it’s cool or complex or anything else they often discuss – it’s to solve real business problems. That’s the message and IBM gets it. Folks tend to forget just how many years dinosaurs roamed the earth. While the younger BI companies are moving faster in technology, getting the ears of business people and building a solution that’s useful to them matters.

Summary

Fern Halper did a nice review of the basics about BI, but I think the TDWI view of predictive analytics is too much industry group think. It’s still aligned with technology as the focus, not the needs of business. IBM is pushing a message that matters to business, showing that it’s the business results that drive technology.

Businesses have been doing predictive analysis for a long time, as long as there’s been business. The advent of predictive analytics is just a continuance of the march of software to increase access to business information and improve the ability for business management to make timely and accurate decisions in the market place. The sooner the BI industry realize this and start focusing less on just how cool data scientists are and more on how cool it is for business to improve performance, the faster adoption of the technology will pick up.

Yellowfin 7.1: Steady progress

Yellowfin held their 7.1 global release Webinars on Wednesday and I listened to the first. The presenters were Glen Rabie, CEO, and Daniel Shaw-Dennis, GM for EMEA.

The key point I took from it was their clear understanding that self-service isn’t the end-all of BI. One early slide pointed out they are concerned with making “A find balance between the needs of self-service users and enterprise IT.” All of us want to allow knowledge workers to more easily understand their business, but data must have some centralized control to security, consistency and validity requirements. It’s nice to hear vendors, and Yellowfin isn’t the only one, begin moving away from the extreme self-service message.

Another critical point is their claim that only 10% of their users want to create data and the other 90% want to consume. They pointed out that they want to focus on the 10%, providing tools that allow for faster and easier creation. Given their demonstration, I believe them. I don’t think the 90% is going to easily get up to speed, but the power for the 10% is very good. The only question is how sustainable that model is.

One way they’re making it easier to create is by extending the power of auto-charting. Vendors are also realizing the business users start with their data and many applications demand they pick graphics (histograms, line graphs, etc) both too early and to people who might not be clear about which is the best chart to use. Yellowfin is helping users by using under-the-hood analysis to suggest default display methods while still allowing the method to be easily changed. That’s a great way to speed visualization and understanding of the data.

Another key YellowFin 7.1 enhancement area has to do with Glen’s statement that 80% of all business data has a location component. Yellowfin is adding a much stronger geospatial package. They are creating what they call Geo-Packs to provide customers with information that helps with geospatial customer, logistical and other analysis. While the package is in the infancy and, as usual with companies focused on the large US market, aren’t strongly fleshed except for the US, it’s a great start and it looks like the company has built in a way to easily expand.

Finally, they announced a marketplace to share reports between customers but, to be honest, who hasn’t? It’s rapidly becoming standard functionality in the marketplace, a “me to!” It’s good they’re adding that but, so far, I’ve mainly seen companies putting out their own reports for customer consumption. I haven’t seen the market mature enough yet for major sharing between customers. It’s needed, but still early to be of full value.

Summary

Yellowfin 7.1 continues to focus on helping power users create analytics for consumption by business knowledge workers. The focus on balancing self-service with the needs of data governance is very good while the growth of geospatial analysis has a strong start.

Their messages and products seem to be working together to continue to give them a good presence and strong growth potential in the marketplace.

DataHero at the BBBT: A Startup Getting It Right

First, on a tangent not directly focused on the product: Thank you Chris Neumann, CEO or DataHero. After hearing presenters from multiple companies consistently use the wrong words over the last few months, you used both premise and premises in the appropriate places. Thanks!

As you might gather, Wednesday’s presentation at the BBBT was by DataHero. A fairly young company, less than three years old, DataHero is focused on “Delivering a self-service Cloud BI solution that enables enterprise and SMB users to analyze and visualize their SAAS-based data without IT.”

Self-service BI is what almost all the players, both new and mature companies, are trying to provide these days. This just means they’re another player in attempting to help business knowledge workers to connect to data, analyze it and gather useful and actionable information without heavy intervention by business analysts and IT.

Cloud is also where everyone’s moving since it has so many advantages to all areas of software. DataHero, as a small company, isn’t just in the Cloud. They’ve smartly decided to begin by focusing on public Cloud applications with accessible API’s.

While that initially simplifies things, the necessity to handle complexity still exists in that world. Mike Ferguson, another BBT member analyst, pointed out that many of his clients have multiple, customized Salesforce.com instances and that’s bringing the upgrade issues seen in on-premises systems into the Cloud world. Chris acknowledges that and understands the need to grow to handle the issue, but knows that at the current size of DataHero there’s enough of a market for an initially more focused solution.

A strategic issue comes up with the basic nature of the Cloud. Mr. Neumann mentioned Cloud being opposed to centralized data, but that’s not quite so. Depending on how Cloud systems are set up, they can help or hinder centralization of data. However, right now he is accurate in that most of the growth of Cloud is departmental in nature. It’s also further blurring the always fuzzy line between enterprise and SMB markets by providing applications that both groups can leverage.

Another area that shows thought in their growth strategy is entry into new market. Chris is clear that they dip their toes into an arena, check reactions, and if positive then try to partner with as many companies in the space as possible to maintain neutrality. That means they don’t get locked into the first vendor the first client wants to work with, regardless of market control, leaving flexibility for customers. Their partner page, though young, clearly shows that strategy in effect. That’s a good move and I wish more vendors would think that way.

Another key growth issue is data cleansing. Right now, DataHero does none, expecting that the source system provides that capability. However, as clients use more and more source systems, there’s a cleansing need to clarify data clashes from different systems. That’s something the team at DataHero says they’re aware of while, again, that’s future growth (no time frames, as per legal sanity…).

The demo was very interesting. The other founder, Jeff Zabel, has a strong history in designing interfaces for software in vehicles, meaning usability really matters. That can be seen with a very clear and simple interface. It is easy to use. However, as pointed out by many other companies, 80% of business data has a location component and many DataHero vendors are far ahead of them in the area of geospatial information. That’s a key area they’ll have to improve.

Summary

DataHero is a young company with a young product. The key is that they aren’t just looking at their cool product and customizing solely on first sales. They have thought through a clear growth strategy. The BI tool is clearly fully fledged for the market segment they’ve chosen for initial release and they have thought through their growth strategy in far more detail than I’ve seen in other vendors who have presented at the BBBT.

If they execute their vision, and I see no reason why they wouldn’t, the folks at DataHero have a bright future.