Category Archives: Business Intelligence

SAS: Out of the Statisticians Pocket and into the Business Briefcase

I just saw an amusing presentation by SAS. Amusing because you rarely get two presenters who are both as good at presenting and as knowledgeable about their products. We heard from Mike Frost, Senior Product Manager for Data Management, and Wayne Thompson, Chief Data Scientist. They enjoy what they do and it was contagious.

It was also interesting from the perspective of time. Too many younger folks think if a firm has been around for more than five years, it’s a dinosaur. That’s usually a mistake, but the view lives on. SAS was founded almost 40 years ago, in 1976, and has always focused on analytics. They have been historically aimed at a market that is made up of serious mathematicians doing heavy statistical work. They’re very good at what they do.

The business analysis sector has been focused on less technical, higher level business number crunching and data visualization. In the last decade, computing power has meant firms can dig deeper and can start to provide analysis SAS has been doing for decades. The question is whether or not SAS can rise to the challenge. It’s still early, but the answer seems to be a qualified but strong “yes!”

Both for good and bad, SAS is the largest privately held software company, still driven by founder James Goodnight. That means a good thing in that technically focused folks plow 23% of their revenue into R&D. However, it also leaves a question mark. I’ve worked for other firms long run by founders, one a 25+ year old firm still run by brothers. The best way to refer to the risk is that of a famous public failure: Xerox and the PC. For those who might not understand what I’m saying, read “Fumbling the Future” by Smith and Alexander. The risk comes down to the people in charge knowing the company needs to change but being emotionally wedded to what’s worked for so long.

The presentation to the BBBT shows that, while it’s still early in the change, SAS seems to be mostly avoiding that risk. They’re moving towards a clean, easier to use UI and taking their first steps towards collaboration. More work needs to be done on both fronts, but Mike and Wayne were very open and honest about their understanding the need and SAS continuing to move forward.

One of the key points by Mike Frost is one I’ve also discussed. While they disagree with me and think the data scientist does exist, the SAS message is clear that he doesn’t work in a void. The statistician, the business analyst and business management must all work in concert to match technical solutions to real business information needs.

LASR, VAE and a cast of thousands

The focus of the presentation was on SAS LASR, their in-memory analytics server. While it leverages Hadoop, it doesn’t use MapReduce because that involves disk access during processing, losing the speed advantage of in-memory applications.SAS LARS archictecture slide
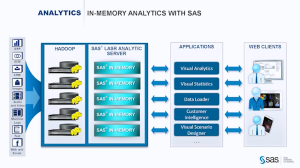
As Mike Frost pointed out, “It doesn’t do any good to run the right model too late.”

One point that still shows the need to think more about business, is that TCO was mentioned in passing. No slide or strong message supported the message. They’re still a bit too focused on technology, not what sells the business decision makers on business intelligence (BI).

Another issue was the large number of ancillary products in the suite, including Visual Data Explorer, Data Loader and others. The team mentioned that SAS is slowly moving through the products to give them the same interface, but I also hope they’re looking at integrating as much as possible so the users don’t have the annoyance of constantly moving between products.

One nice part of the demo was an example of discussing what SAS has termed “poorly structured data” as opposed to “unstructured data” that’s the rage in Hadoop. I prefer “loosely structured data.” Mike and Wayne showed the ability to parse the incoming file and have machine intelligence make an initial pass at suggesting fields. While this isn’t new, I worked at a company in 2000 that was doing that, it’s a key part of quickly integrating such data into the business environment. The company I reference had another founder who became involved in other things and it died. While I’m surprised it took firms so long to latch onto and use the technology, it doesn’t surprise me that SAS is one of the first to openly push this.

Another advantage brought by an older, global firm, related to the parsing is that it works in multiple languages, including right-to-left languages such as Hebrew and Arabic. Most startups focus on their own national language and it can be a while before the applications are truly global. SAS already knows the importance and supports the need.

Great, But Not Yet End-To-End

The only big marketing mistake I heard was towards the end. While Frost and Thompson are rightfully proud of their products, Wayne Thompson crowed that “We’re not XXX,” a reference to a major BI player, “We’re end-to-end.” However, they’d showed only minimal visualization choices and their collaboration, admittedly isn’t there.

Even worse for the message, only a few minutes later, based on a question, one of the presenters shows how you export predicted values so that visualization tools with more power can help display the information to business management.

I have yet to see a real end-to-end tool and there’s no reason for SAS to push this iteration as more than it is. It’s great, but it’s not yet a complete solution.

Summary

SAS is making a strong push into the front end of analytics and business intelligence. They are busy wrapping tools around their statistical engines that will allow them to move much more strongly out of academics and the very technical depths of life sciences, manufacturing, defense and other industries to challenge in the realm of BI.

They’re headed in the right direction, but the risk mentioned at the start remains. Will they keep focused on this growing market and the changes it requires, or will that large R&D expenditure focus on the existing strengths and make the BI transition too slow? I’m seeing all the right signs, they just need to stay on track.
 

TDWI Webinar Review: David Loshin & Liaison on Data Integration

The most recent TDWI webinar had a guest analyst, David Loshin of Knowledge Integrity. The presentation was sponsored by Liaison and that company’s speaker was Manish Gupta. Given that Liaison is a cloud provider of data integration, it’s no surprise that was the topic.

David Loshin gave a good overview of the basics of data integration as he talked about the growth of data volumes and the time required to manage that flow. He described three main areas to focus upon to get a handle on modern integration issues:

  • Data Curation
  • Data Orchestration
  • Data Monitoring

Data curation is the organization and management of data. While David accurately described the necessity of organizing information for presentation, the one thing in curation that wasn’t touched upon was archiving. The ability to present a history of information and make it available for later needs. That’s something the rush to manage data streams is forgetting. Both are important and the later isn’t replacing the former.

The most important part of the orchestration Mr. Loshin described was in aligning information for business requirements. How do you ensure the disparate data sources are gathered appropriately to gain actionable insight? That was also addressed in Q&A, when a question asked why there was a need to bother merging the two distinct domains of data integration and data management. David quickly pointed out that there was no way not to handle both as they weren’t really separate domains. Managing data streams, he pointed out, was the great example of how the two concepts must overlap.

Data monitoring has to do with both data in motion, as in identifying real-time exceptions that need handling, and data for compliance, information that’s often more static for regulatory reporting.

The presentation then switched to Manish Gupta, who proceeded to give the standard vendor introduction. It’s necessary, but I felt his was a little too high level for a broader TDWI audience. It’s a good introduction to Liaison, but following Mr. Loshin there should have been more detail on how Liaison addresses the points brought up in the first half of the presentation – Just as in a sales presentation, a team would lead with Mr. Gupta’s information, then the salesperson would discuss the products in more detail.

Both presenters had good things to say, but they didn’t mesh enough, in my view, and you can find out far more talking to each individually or reading their available materials.

Semantics and big data: Thought leadership done right

Dataversity hosted a webinar by Matt Allen, Product Marketing Manager at MarkLogic. Mr. Allen’s purpose was to explain to the audience the basic challenges involved in big data which can be addressed by semantic analysis. He did a good job. Too many people attempting the same spend too much time on their own product. Matt didn’t do so. Sure, when he did he had some of the same issues that many in our industry have, of over selling change; but the corporate references were minimal and the first half of the presentation was almost all basic theory and practice.

Semantics and Complexity

On a related tangent, one of the books I’m reading now is Stanley McChrystal’s “Team of Teams.” In it, he and his co-authors point to a distinction between complicated and complex. A manufacturing process can be complicated, it can have lots of steps but have a clearly delineated flow. Complex problems have many-to-many relations which aren’t set and can be very difficult to understand.

That ties clearly into the message put forward by MarkLogic. The massive amount of unstructured data is complex, with text rather than fields and which need ways of understanding potential meaning. The problems in free text are such things as:

  • Different words can define the same thing.
  • The same word can mean different things in different contexts.
  • Depending on the person, different aspects of information are needed for the same object.

One great example that can contain all for issues was given when Matt talked about the development process. At different steps in the process, from discovery, to different development stages to product launch, there’s a lot of complexity in meanings of terms not only in development organizations but between them and all the groups in the organization with whom they have to work.

Mr. Allen then moved from discussing that complexity to talking about semantic engines. MarkLogic’s NoSQL engine has a clear market focus on semantic logic, but during this section he did well to minimize the corporate pitch and only talked about triples.

No, not baseball. Triples are a syntactical tool to link subject (person), predicate (operates), object (machine). By building those relationship, objects can be linked in a less formal and more dynamic manner. MarkLogic’s data organization is based on triples. Matt showed examples of JSON, Turtle and XML representations of triples, very neatly sliding his company’s abilities into the theory presentation – a great example of how to mention your company while giving a thought leadership presentation without being heavy handed.

Semantics, Databases and the Company

The final part of the presentation was about the database structure needed to handle semantic analytics. This is where he overlapped the theory with a stronger corporate pitch.

Without referring to a source, Mr. Allen stated that relation databases (RDBMS’) can only handle 20% of today’s data. While it’s clear that a lot of the new information is better handled in Hadoop and less structured data sources, it’s a question of performance. I’d prefer to see a focus on that.

Another error often made by folks adopting new technologies was the statement that “Relational databases aren’t solving a lot of today’s problems. That’s why people are moving to other technologies.” No, they’re extending today’s technologies with less structured databases. The RDBMS isn’t going away, as it does have its purpose. The all or nothing message creates a barrier to enterprise adoption.

The final issue is the absolutist view of companies that think they have no competitor. Mark Allen mentioned that MarkLogic is the only enterprise database using triples. That might be literally true. I’m not sure, but so what? First, triples aren’t a new concept and object oriented databases have been managing triples for decades to do semantic analysis. Second, I recently blogged about Teradata Aster and that company’s semantic analytics. While they might not use the exact same technology, they’re certainly a competitor.

Summary

Mark Allen did a very good job exposing people to why semantic analysis matters for business and then covered some of the key concepts in the arena. For folks interested in the basics to understand how the concept can help them, watch the replay or talk with folks at MarkLogic.

The only hole in the presentation is that though the high level position setting was done well, the end where MarkLogic was discussed in detail had some of the same problems I’ve seen in other smaller, still technology driven companies.

If Mr. Allen simplifies the corporate message, the necessary addition at the end of the presentation will flow better. However, that doesn’t take away from the fact that the high level overview of semantic analysis was done very well, discussing not only the concepts but also a number of real world examples from different industries to bring those concepts alive for the audience. Well done.

Marketing lesson: How to cram too many vendors into too short a timeframe

I’ll start by being very clear: This is a slam on bad marketing. Do not take this column as a statement that the products have problems, as we didn’t see the products.

Database Trends and Application magazine/website held a webinar. The first clue there was something wrong is that an hour long seminar had three sponsors. In a roundtable forum, that could work, and the email mentioned it was a roundtable, but it wasn’t. Three companies, three sequential presentations. No roundtable.

It was titled “The Future of Big Data: Hybrid Architectures and Best-of-Breed”. The presenters were Reiner Kappenberger, Global Product Manager, HP Security Voltage, Emma McGrattan, SVP Engineering, Actian, and Ron Huizenga, ER/Studio Product Manager, Embarcadero. They are three interesting companies, but how would the presentations fit together?

They didn’t.

Each presenter had a few minutes to slam through a pitch, which they did with varying speeds and content. There was nothing tying them into a unified vision or strategy. That they all mentioned big data wasn’t enough and neither was the time allotted to hear significant value from any of them.

I’ll burn through each as the stand-alone presentations they were.

HP Security Voltage

Reiner Kappenberger talked about his company’s acquisition by HP earlier this year and the major renaming from Voltage Security to HP Security Voltage (yes, “major” was used tongue-in-cheek). Humor aside, this is an important acquisition for HP to fill out its portfolio.

Data security is a critical issue. Mr. Kappenberger gave a quick overview of the many levels of security needed, from disk encryption up to authentication management. The main feature focus on Reiner’s allotted time is partial tokenization, being able to encrypt parts of a full data field. For instance, disguising the first five digits of a US Social Security number while leaving the last four visible. While he also mentioned tying into Hadoop to track and encrypt data across clusters, time didn’t permit any details. For those using Hadoop for critical data, you need to find out more.

The case studies presented included a car company’s use of both live, Internet of Things feeds and recall tracking but, again, there just wasn’t enough time.

Actian

The next vendor was Actian, an analytics and business intelligence (BI) player based on Hadoop. Emma McGrattan felt rushed by the time limit and her presentation showed that. It would have been better to slow down and cover a little less. Or, well, more.

For all the verbage it was almost all fluff. “Disruption” was in the first couple of sentences. “The best,” “the fastest,” “the most,” and similar unsubstantiated phrases flowed like water. She showed an Actian built graph with product maturity and Hadoop strength on the two axis and, as if by magic, the only company in the upper right was Actian.

Unlike the presentations before and after hers, Ms. McGrattan’s was a pure sales pitch and did nothing to set a context. My understanding, from other places, is that Actian has a good product that people interested in Hadoop should evaluate, but seeing this presentation was too little said in too little time with too many words.

In Q&A, Emma McGrattan also made what I think is a mistake, one that I’ve heard many BI companies get away from in the last few years. An attendee asked about biggest concern when transitioning from EDW to Hadoop. The real response should be that Hadoop doesn’t replace the EDW. Hadoop extends the information architecture, it can even be used to put an EDW on open source, but EDWs and big data analytics typically have two different purposes. EDWs are for clean, trusted data that’s not as volatile, while big data is typically transaction oriented information that needs to be cleaned, analyzed and aggregated before it’s useful in and EDW. They are two tools in the BI toolbox. Unfortunately, Ms. McGrattan accepted the premise.

Embarcadero

Mr. Huizenga, from Embarcadero, referred to evidence that the amount of data captured in business is doubling every 1.2 years and how the number of related jobs is also exploding. However, where most big data and Hadoop vendors would then talk about their technologies manipulating and analyzing the data, he started with a bigger issue: How do you begin to understand and model the information? After all, schema-on-write still means you need to understand the information enough to create schemas.

That led to a very smooth shift to a discussion about the concept of modeling to Embarcadero. They’ve added native support for Hive and MongoDB, they can detect embedded objects in those schemas and they can visually translate the Hadoop information into forms that enterprise IT folks are used to seeing, can understand and can add to their overall architecture models.

Big data doesn’t exist in a void, to be successful it must be integrated fully into the enterprise information architecture. For those folks already using ERwin and those who understand the need to document modeling, they are a tool that should be investigated for the world of Hadoop.

Summary

Three good companies were crammed into a tiny time slot with differing success. The title of the seminar suggested a tie that was stronger than was there. The makings existed for three good webinars, and I wish DBTA had done that. The three firms and the host could have communicated to create an overall message that integrated the three solutions, but they didn’t.

If you didn’t see the presentation, don’t bother. Whichever company interests you check it out. All three are interesting though it might have been hard to tell from this webinar.

Teradata Aster: NLP for Business Intelligence

Teradata’s recent presentation at the BBBT was very interesting. The focus, no surprise, was on Teradata Aster, but Chris Twogood, VP Products and Services Marketing, and John Thuma, Director of Aster Strategy and Analytics, took a very different approach than was taken a year earlier.

Chris Twogood started the talk with the usual business overview. Specific time was spent on four recent product announcements. The most interesting announcement was about their support for Presto, a SQL-on-Hadoop project. They are the first company to provide commercial support for the open source technology. As Chris pointed out, he counted “13 different SQL-on-Hadoop variants.” Because of the importance of SQL access and the perceived power of Presto, Teradata has committed to strengthening its presence with that offering. SQL is still the language for data access and integrating Hadoop into the rest of the information ecosystem is a necessary move for any company serving any business information market. This helps Teradata present a leadership image.

Discussion then turned to the evolution of data volumes and analytics capabilities. Mr. Twogood has a great vision of that history, but the graphic needs serious work. I won’t copy it because the slide was far too busy. The main point, however, was the link between data volumes and sources with the added capabilities to look at business in a more holistic way. It’s something many people are discussing but he seems to have a much better handle on it than most others who talk to the point, he just needs to fine tune the presentation.

Customers and On-Site Search

As most people have seen, the much of the new data coming in under the big data rubric is customer data from sources such as the web, call logs and more. Being able to create a more unified view of the customer matters. Chris Twogood wrapped up his presentation by referring to a McKinsey & Co. survey that pointed out, among other things, that studying customer journeys can increase predictive accuracy of customer satisfaction and churn by 30-40%. Though it also points out that 56% of customer interactions are through multi-channel means, one of the key areas of focus today is the journey through a web site.

With that lead-in, John Thuma took over to talk about Aster and how it can help with on-site search. He began by stating that 25-30% of web site visitors using search leave the site if the wanted result isn’t in first three items returned, while 75% abandon if the result isn’t on first page. Therefore it’s important to have searches that understand not only the terms that the prospective customer enters but possible meanings and alternatives. John picked a very simple and clear example, depending on the part of the country, somebody might search on crock pot, slow cooker or pressure cooker but all should return the same result.

While Mr. Thuma’s presentation talked about machine learning in general, and did cover some of the other issues, the main focus of that example is Natural Language Processing (NLP). We need to understand more than the syntax of the sentence, but also improve our ability to comprehend semantic meaning. The demonstration showed some wonderful capabilities of Aster in the area of NLP to improve search capabilities.

One feature is what Teradata is calling “apps,” a term that confuses them with mobile apps, a problematic marketing decision. They are full blown applications that include powerful capabilities, applications customization and very nice analytics. Most importantly, John clearly points out that Aster is complex and that professional services are almost always required to take full advantage of the Aster capabilities. I think that “app” does a disservice to the capabilities of both Aster and Teradata.

One side bar about technical folks not really understanding business came from one analyst attending the presentation who suggested that ““In some ways it would be nice to teach the searchers what words are better than others.” No, that’s not customer service. It’s up to the company to understand which words searchers mean and to use NLP to come up with a real result.

A final nit was that the term “self-service” was used while also talking about the requirement for both professional services from Teradata and a need for a mythical data scientist. You can’t, as they claimed, used Aster to avoid the standard delays from IT for new reports when the application process is very complex. Yes, afterwards you can use some of the apps like you would a visualization tool which allows the business user to do basic investigation on her own, but that’s a very limited view of self-service.

I’m sure that Teradata Aster will evolve more towards self-service as it advances, but right now it’s a powerful tool that does a very interesting job while still requiring heavy IT involvement. That doesn’t make it bad, it just means that the technology still needs to evolve.

Summary

I studied NLP almost 30 years ago, when working with expert systems. Both hardware and software have moved forward, thankfully, a great distance since those days. The ability to leverage NLP to more quickly and accurately to understand the market, improve customer acquisition and retention ROI and better run business is a wonderful thing.

The presentation was powerful and clear, Teradata Aster provides some great benefits. It is still early in its lifecycle and, if the company continues on the current course, will only get better. They have only a few customers for the on-site optimization use, none referenceable in the demo, but there is a clear ROI message building. Mid- to large-size enterprises looking to optimize their customer understand, whether for on-site search or other modern business intelligence uses, should talk to Teradata and see if Aster fits their needs.

Review: Looker Webinar on Embedding BI

Looker held a webinar today. I recently blogged about their presentation to the BBBT community, but it’s an interesting company so was worth another visit. The company is a business intelligence (BI) firm. With the presenters being Colin Zima and Zach Taylor, the presentation stayed at a much higher level than the previous presentation and was aimed at a business audience rather than analysts. It is always good to see a different view of things.

The focus of their presentation is why it’s good to embed BI in other applications in opposition to pure BI tools. It’s a good message but needs to be strengthened. Colin and Zach quickly mentioned embedding as if everyone understood it, then dove into the issues in evaluation the build v buy decision. They should have spent a couple of minutes explaining what they mean by embedding and their focus on what they focus on as places to be embedded into.

Their build v buy decision discussion was standard and hit all the right points about letting companies focus on their competencies and leverage the BI industry’s competencies for analysis. Where embedding and build v buy really blend, and they could have hit harder, is the difference in ROI between embedding and having a separate BI visualization tool.

They did have a couple of case studies that were interesting. Ibotta is a company providing analytics to their consumer packages goods clients. That’s a great application and a powerful use of BI in a business network, but I didn’t see much on what it was embedded into or how. That meant it didn’t fit into the overall scheme of the presentation.

The other key one was HubSpot using Looker to provide analytics to sales on sales performance. That’s done by embedding the analytics directly into the normal Saleforce.com windows the sales team see every day. That’s a powerful message and one that I felt deserved a bit more time.

The only questionable message I heard was during Q&A, when somebody asked about their performance issues. As in the previous presentation, they talked about using the source data and not replicating for BI. They therefore said they didn’t have performance issues when scaling users but it was one for the databases. Well, that’s not quite true.

It’s not likely that all a company’s various data sources have been built to scale to lots of users. Companies will still use ODS’s, data warehouses and other methods to parallel data and have multiple versions of the truth which require strong compliance to control. Companies will still have to spend time to analyze and prepare appropriate data sources that can handle large numbers of concurrent users. The advantage of Looker is not that it means that you don’t have to add to the confusion to get performance, whatever is provided to get good performance for Looker isn’t unique and limited to it but can serve other applications as well.

Looker is that rare young company that seems to not only have a good early generation product, but understands how to market their product to multiple audiences. As someone focused on software marketing, I think that’s great.

TDWI Webinar Review: Claudia Imhoff and SAP with an overview of the analytics supply chain

Tuesday’s TDWI webinar had a guest star: Claudia Imhoff. The topic was predictive analytics and the presentation was sponsored by SAP, so Pierre Leroux, Director of Product Marketing, SAP, also had his moment towards the end. Though the title was about predictive analytics, it’s best to view the presentation as an overview of the state of analytics, and there’s much more to discuss on that.

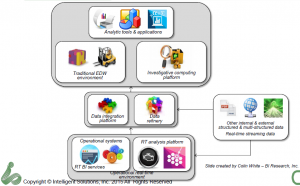
The key points revolved around a descriptive slide Ms. Imhoff presented to describe the changing analytics landscape.

TDWI Imhoff analytics supply chain

Claudia Imhoff described the established EDW information supply chain as being the left half of the diagram while the newer information, with web, internet of things (IOT) and other massive data sources adding the right hand side. It’s a nice, clean way of looking at things and makes clear that the newer data can still drive rather than eliminate the EDW.

One thing I’d say is missing is a good name for the middle box. Many folks call was Ms. Imhoff terms the Date Refinery a Data Lake or other similar rationalizations. My issue is that there’s really no need to list the two parts separate. In fact, there’s a need to have them seamlessly accessible as a whole, hence the growth of SQL for Hadoop and other solutions. As I’ve expressed before, the combination of the data integration and data refinery displayed are just the next generation of the ODS. I like the data refinery label, but think it more accurately applies to the full set of data described in the middle section of the diagram.

Claudia also described, the four types of analytics:

  • Descriptive: What happened.
  • Diagnostic: Why it happened.
  • Predictive: What might happen.
  • Prescriptive: What to do when it happens.

It’s important to understand the difference in analysis because each type of report needs to have a focus and an audience. One nit I have with her discussion of these was the comment that descriptive analytics are the least valuable. Rather, they’re the least strategic. If we don’t know what happened, we can’t feed the other types of analytics, plus, reporting requirements in so much of business means that understanding and reporting what happened remains very valuable. The difference is not how valuable, but in what way. Predictive and prescriptive analytics can be more valuable in the long term, but their foundation still resides on descriptive.

Not more with the Data Scientist…

My biggest complaint with our industry at large is still the obsession with the mythical data scientist. Claudia Imhoff spent a good amount of time on the subject. It’s a concept with super human requirements, with Claudia even saying that the data scientist might be the one with deep business knowledge. Nope. Not going to happen.

In Q&A, somebody brought up the point I always mention: Why does it have to be one person rather than a team. Both Claudia Imhoff and Pierre Leroux admitted that was more likely. I wish folks would start with that as it’s reasonable and logical.

I was a programmer as folks began calling themselves software engineers. I never liked that. The job wasn’t engineering but a blend of engineering and crafting. There was art. The two presenters continued to talk about the data scientist as having an art component, but still think that means the magical person is still a scientist. In addition, thirty year ago the developer was distanced much further from business, by development methods, technology and business practice. Being closer means, again, teamwork, with each person sharing expertise in math, coding, business and more to create a robust solution.

That wall has been coming down for years, but both technology and business are changing rapidly and are far more complex. The team notion is far more logical.

Business and Technology

The other major problem I had was a later slide and words accompanying it that implied it’s up to the business people to get on board with what the technologists are doing. They must find the training, they must learn that analytics are the answer to everything.

Yes, we’re able to provide better analytics faster to management than in the past. However, they’re not yet perfect nor will they be. Models are just that. As Pierre pointed out, models will never explain 100%.

Claudia made a great point earlier about one of the benefits of big data is to eliminate sampling and look at what the entire market is doing, but markets are still complex and we can’t glean everything. Technologists must get of the high horse and realize that some of the pushback from management is because the techies too often tend to dismiss intuition and experience. What needs to happen is for the messages to change to make it clear that modern analytics will help executives and line management make better decisions, not that it will replace their decision making.

In addition, quit making overly complex visualization that have great scientific relevance but waste time. The users do not need to understand the complexities of systems. If we’re so darned smart, we can distill the visualizations to things easier to comprehend so that managers can get the information, add it to all the other information and experience and make decision.

Technologists must adapt to how business runs as much as business must adapt to leverage technology.

Summary

The title of the presentation misrepresents the content. It was a very good presentation for understanding the high level landscape of the analytics information supply chain and it’s a discussion that needs to be held more often.

You’ll notice I didn’t say much about the demo by Pierre Leroux. That’s because of technical issues between demo and webinar software. However, both he and Claudia Imhoff took questions about the industry and market and gave thoughtful answers that should help drive the conversation forward.

TDWI Webinar Review: What is Data Platform as a Service (dPaaS) and What Can it Do For Your Business?

Yesterday’s TDWI webinar was sponsored by Liaison Technologies, who did the same thing last year. It’s a push for another acronym. While the acronym isn’t needed, the concept is. Data Platform as a Service is just using the cloud to help with data integration. Gosh, complex, ‘eh? I think it’s the natural progression of technology and business, it’s just data management on the cloud. But forget the marketing, let’s talk about the concept.

Cloud data management

The presentation’s first half was delivered by Phillip Russom. He started with some very trivial level setting but then quickly got to a key point. If you’ve been around for a while, you remember Best of Breed. That’s when each vendor focused product company, somewhere in the information supply chain, talked about their openness and how you could piece together a solution from different vendors. That made sense at the time, since many companies were each creating the early version of parts of a full solution.

As Phillip pointed out, times have changed. We now better understand business needs, have learned more about coding the requirements and can access far better hardware than we had fifteen years ago. That means IT is looking for what they couldn’t find back then: An integrated solution from a single or a far more limited number of vendors. They want something simpler than a hodgepodge of multiple systems.

The advantages of the cloud aren’t specific to data management. One very key business driver that was minimized in Mr. Russom’s presentation but brought out later by Patrick Adamiak during his presentation then revisited by both in the Q&A is capex versus opex – something often ignored by technical folks. Having your own hardware and data center is not just costly, it’s part of capital expenditure. Service contracts with a cloud vendor are operational expenses. That means the CxO suite and Board are often happier with that because it’s not as locked it and creates flexibility in the corporate financial picture.

One nit I had with Mr. Russom’s presentation was his statement that cloud is another architecture, like client/server or the web. The cloud and web are client server, that’s not the issue. It’s another architecture in two other key aspects: The already mentioned capex/opex divide, and the way it changes a software vendor’s ability to manage and update their software in comparison to on-premises installations.

One caution he gave that needed more explanation for folks new to the cloud was when Mr. Russom mentioned that you need to ask about the elasticity of the cloud implementation. For those who might not have heard the term, elasticity is the ability to grow or shrink cloud resources in order to match processing demands. In other words, if you get a big data dump from another source, can you quickly access more disk space? Or, from the Web side of the house: You’re hosting a big event or making a major announcement on your Web site: Can site resources be replicated quickly to handle the additional load then released when no longer needed?

Liaison

I was impressed by the fact that capex was mentioned on Patrick Adamiak’s first slide. Cloud technology has multiple advantages that can be communicated to IT, but it’s the capex/opex issue that will help close the deal in an enterprise setting. Liaison seems to understand the need to blend technical and business messages.

However, most of Mr. Adamiak’s presentation seemed to be about justifying the new acronym. The main slide compared dPaaS with other supposed solutions without admitting there’s really a lot of overlap between them. The columns weren’t as different as he’d like them to be.

His company slides didn’t seem any different than those I’ve seen from the many other firms in the space. Forget all of that, it was in a short webinar with TDWI, so he had limited time.

The fact is that Liaison claims they are where the market is going. They are vertically integrating the information supply chain while leveraging the cloud for its business and technology advantages. For those in IT looking to simplify their world, Liaison is a company that should be investigated.