ClearStory at BBBT: Good, But Still A Bit Opaque

Clearstory Data presented to the BBBT last week. The company is presenting itself as an end-to-end BI company, providing data access through display. Their core is what they call Data Harmonization, or trying to better merge multiple data stores into a current whole.

Data Harmonization

The presentation started with Andrew Yeung, Director of Product Marketing, giving the overview slides. The company was founded by some folks from Aster Data and has about sixty people and its mission is to “Converge more data sources faster and enable frontline business users to do collaborative data exploration to ‘answer new questions.’” A key fact Andrew brought up was that 74% of business users need to access four or more data sources (from their own research). As I’ve mentioned before, the issue is more wide data than big data, and this company understands that.

If that sounds to you like ETL, you’ve got it. Everyone thinks they have to invent new terms and ETL is such an old one and has negative connotations, so they’re trying to rebrand. There’s nothing wrong with ETL, even if you rationalize its ELT or harmonization, it’s still important and the team has a good message.

The key differentiator is that they’re adding some fundamental data and metadata to improve the blending of the data sources. That will help lower the amount of IT involvement in creating the links and the resulting data store. Mr. Yeung talked about how the application inferred relationships between field based on both data and metadata to both link data sources and infer dimensions around the key data.

Andrew ended his segment with a couple of customer stories. I’ll point out that they were anonymous, always something in my book. When a firm trusts enough to let you use its name, you have a certain level of confidence. The two studies were a CPG company and a grocery chain, good indications of ClearStory’s ability to handle large data volumes.

Architecture

The presentation was then taken over by Kumar Srivastava, Senior Director of Product Management, for the architecture discussion.
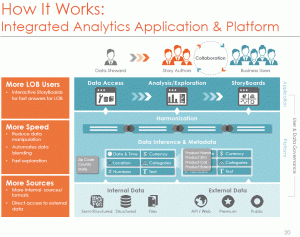
ClearStory at BBBT - Architecture slide

ClearStory is a cloud service provider, with access to corporate systems but work is done on their servers. Mr. Srivastava started by stating that the harmonization level and higher are run in-memory on Apache Spark.

That led to the immediate question of security. Kumar gave all the right assurances on basic network security and was also quick to transition to, not hide, the additional security and compliance issues that might prevent some data from being moved from inside the firewall to the cloud. He also said the company suggests clients mask critical information but ClearStory doesn’t yet provide the service. He admitted they’re a young firm and still working out those issues with their early customer. That’s a perfectly reasonable answer and if you talk with the company, be sure to discuss your compliance needs and their progress.

Mr. Srivastava also made a big deal about collaborative analytics, but it’s something everyone’s working on, he said nothing really new and the demo didn’t show it. I think collaboration is now a checklist item, folks want to know a firm has it, but aren’t sure how to use it. There’s time to grow.

The last issue discussed by Kumar was storyboards, the latest buzzword in the industry. He talked about them being different then dashboards and then showed a slide that makes them look like dashboards. During the demo, they show as more dynamic dashboards, with more flexible drilldown and easy capture of new dashboard elements. It’s very important but the storyboard paradigm is seriously overblown.

Demo

The final presenter was Scott Anderson, Sales Engineer, for the demonstration. He started by showing they don’t have a local client but just use a browser. Everyone’s moving to HTML5 so it’s another checklist item.

While much of the demo flew by far too quickly to really see how good the interface was, there was one clear positive element – though some analysts will disagree. Based on the data, ClearStory chooses an initial virtualization. The customer can change that on the fly, but there’s no need to decide at the very front what you need the data to be. Some analysts and companies claim that is bad, that you can send the user in the wrong direction. That’s why some firms still make the user select an initial virtualization. That, to me, is wrong. Quickly getting a visualization up helps the business worker begin to immediately understand the data then fine tune what is needed.

At the end of the presentation, two issues were discussed that had important relevance to the in-memory method of working with data: They’re not good with changing data. If you pull in data and display results, then new data is loaded over it, the results change with no history or provenance for the data. This is something they’ll clearly have to work on to become more robust.

The other issue is the question of usability. They claim this is for end users, but the demo only showed Scott grabbing a spreadsheet off of his own computer. When you start a presentation talking about the number of data sources needed for most analysis, you need to show how the data is accessed. The odds are, this is a tool that requires IT and business analysts for more than the simplest information. That said, the company is young, as are many in the space.

Summary

ClearStory is a young company working to provide better access and blending of disparate data sources. Their focus is definitely on the challenge of accessing and merging data. Their virtualizations are good but they also work with pure BI virtualization tools on top of their harmonization. There was nothing that wowed me but also nothing that came out as a huge concern. It was a generic presentation that didn’t show much, gave some promise but left a number of questions.

They are a startup that knows the right things to say, but it’s most likely going to be bleeding edge companies who experiment with them in the short term. If they can provide what they claim, they’ll eventually get some names references and start moving towards the main market.

As they move forward, I hope to see more.
Datameer and Altiscale: A Tale of Two Startups

A webinar I watched was titled for the announcement of Datameer Professional, but that’s not what caught my interest. I previously blogged about Datameer’s presentation to the BBBT, so you can see where I think they’re a good, basic company who seemed to have a better grasp on the market than most startups. Sadly, that wasn’t shown today. What was most interesting was the part of the presentation that covered Altiscale, a company partnering with Datameer to provide Datameer Professional.

The Basics

The presentation was a tag team between Stefan Groschupf, CEO of Datameer, and Mike Maciag, COO of Altiscale.

It began with Stefan giving a very generic overview of the market. There was little content and that which was there wasn’t a surprise. The main point is that the demand for Hadoop has moved from IT doing behind the scenes work to business users wanting quick analysis. The lack of technical knowledge makes staffing an issue.

That led directly to Mike Maciag talking about how Altiscale provides Hadoop as a service. They’re a cloud provider of Hadoop. With founders from Google, Yahoo and LinkedIn, they understand Hadoop, the cloud and the need of companies to quickly leverage external resources to get to Hadoop with better TCO than would be the case trying to build in-house.

The reason for that quick introduction became apparent as soon as Mike tossed back to Stefan. Datameer Professional is a cloud version of their product that runs on Altiscale in the US. During Q&A, it come out that they’re using a different, unnamed provider in the EU for compliance issues over there.

One feature is they’re claiming they’ll provide three sets of basic analytics with Professional, for customer analysis, operations and cyber security – in that order. However, there was the qualification from Mr. Groschupf of “over the next few months,” so no clue how much is there now or when they’re really be available.

Case Studies

One thing I noticed placed a clear difference between the two companies as for how far they understand business customers. The Datameer customers mentioned were never named. None are approved. Therefore, I have to question the veracity of claims.

The case study presented by Altisoft was a named client. Business users want to know reality and also want to confirm that a customer has enough confidence in a vendor to attach a name.

Summary

The summary combines what I heard today and what I heard at the BBBT presentation.

Datameer is a good startup, but is still focused on technology. BI has a short life cycle and companies need to rapidly prepare for the chasm. As they showed no updates in their UI, don’t have strong market messages and didn’t have a referenced customer, Datameer is a company to look at for technology but I again wonder about the long term strategy and think the technology will be acquisition bait. Look to them for a basic interface, strong underpinnings to they don’t seem focused clearly on end-user business messages.

Altiscale is also a good startup, but they seem better focused on a business message. Perhaps that’s because they are a cloud service company so they know it is important to do so. From the little I saw, they seem to be positioning themselves well as an alternative to Amazon and other choices to help business quickly take advantage of big data on Hadoop. I’d like to hear more.

Both Datameer and Altiscale are worth looking at, but for different reasons and they don’t have to be a set.

TDWI Webinar: Embedded Analytics

The latest TDWI webinar was on embedded analytics. The speakers were Fern Halper, the director of TDWI research for advanced analytics, and Mark Gamble from OpenText. For those of you who hadn’t heard, Actuate was acquired by OpenText and is being rebranded but, according to Mark, will remain an independent division for now.

Ms. Halper’s main point is that embedded has a lot of different meanings for different audiences and that she wants to create a clear framework for understanding the terminology within the analytics space. She’s clear that what’s meant isn’t just into the mass market idea of wearable software, but that analytics can be embedded in specific applications, broader systems and, yes, devices such as mobile and wearable items.

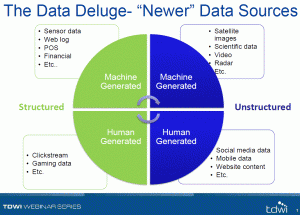
Early in the presentation she presented a two axis image comparing structured and unstructured data combined with human and machine generated data. While I think the coloring should rotate, to emphasize that the difference between machine versus human generated information is a bigger issue than structured v unstructured, it’s a nice way of understanding some of the data streams.

TDWI Embedded Analytics - Data Sources

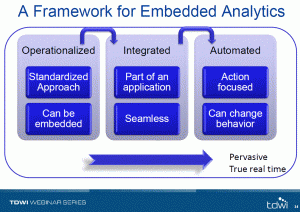
That, however, was a definitional slide and discussion. The real mean of Fern Halper’s presentation was the framework she described to help understand the steps of embedding analytics.

TDWI Embedded Analytics - Framework

Operationalized analytics are those that are involved in the full process of decision making. For instance, a call center employee might be talking to a prospect whose finances are flagged as a question mark. That prospect must be sent to another person to process the decision based on analytics.

Integrated analytics are those that allow the call center operator to see the analysis and immediately make decisions based upon guidelines.

Automated analytics are those that provide the operator with a decision tree response based on analytics done behind the scenes.

The only issue I take with the framework is it doesn’t necessarily mean true real time. The example discussed shows that the integrated approach can be real time for what humans think of as real time within our own interactions. Meanwhile, real-time might not be a necessary component to some automated decisions. Real-time is a separate issue and I think Fern’s framework would be better served by eliminating that item.

Fern Halper followed the framework with the usual and interesting TDWI survey numbers. This time, the questions were focused on the adoption of analytics tied to the framework. The numbers showed the unsurprising fact that analytics adoption is still in its infancy. One of the great parts of TDWI’s numbers is they show the reality which contradicts the industry’s hype.

One set of numbers I’d like to see wasn’t included. The responses were only IT responses in general, who has started using what analytics. I would have loved to see one slide that clearly showed only the sub-segment of companies who are already using analytics tools and where those companies are within Ms. Halper’s framework. Are are the bleeding edge folks doing at moving through the framework to automated solutions?

OpenText

The rest of the program was a fast presentation by Mark Gamble, pointing to OpenText’s (Actuate’s) main benefit claim of enterprise scalability and the other factors. One of the phrases I liked was his reference stating they “adhered to a low code methodology.” It’s nice to hear folks admitting that as much as we want to eliminate coding, some of that is still required. Honesty isn’t a negative in marketing and I liked that turn of phrase.

In the other direction, he mentioned there were over fourteen million downloads of BIRT and that the company “believes” they have over three million users. I’m not interested in belief but they don’t seem to have a clear figure on adoption.

The main problem I had was the demo. Mark showed experimental work positing to show live acquisition of basic automotive information such as speed and RPM displayed on a computer, phone and watch. It was not only not a business case but one that seemed to go back to the misunderstanding about the meaning of embedded which was addressed by Fern. Yes, it was embedded on two devices, but the demo didn’t show how it might be embedded in business applications. It stuck with the flashy concept of wearables.

OpenText might have something good with their analytics portability, but I don’t think the demo presents it to a business audience. Yes, techies will understand the underpinnings that make it cool, but the business folks writing checks need to see something that justifies the expenditure and I don’t think that’s shown.

Summary

Fern Halper did another good job of putting the adoption of analytics into perspective. This time, with a framework for better understanding embedded analytics.

Mark Gamble did a passable job of presenting OpenText’s solution but I feel he must do a better job of figuring out a business message.

TDWI’s data shows the early state of adoption that exists in the market. Fern Halper’s framework will help companies better understand how to move into the arena, but only if the companies providing those solutions can better present how they’ll help solve business issues.

MapR at BBBT: Supporting Hadoop and still learning

I’ve probably used this in other columns, but that’s life. MapR’s presentation to the BBBT reminded me of Yogi Berra’s statement that it feels like déjà vu all over again. Wait, if I think I’ve done this before, am I stuck in a déjà vu loop?

The presentation was a tag team effort of Steve Wooledge, VP Product Marketing, and Tomer Shiran, VP Product Management.

The Products and Their Aim

The first part of the déjà vu was good. People love to talk about freeware, but mission critical solution won’t be trusted on such. Even before Linux, before Unix, software came out and it took companies to package it with service and support to provide constancy and trust for widespread IT adoption. MapR is a key company doing that with Apache Hadoop, the primary open source technology for big data applications.

They’ve done the job well, putting together a strong company that, quite reasonably, has attracted some great investors and customers. Of course, because Hadoop is still in its infancy, even a leading company such as MapR only mentions 700 customer, companies paying for licenses; but that’s a statement about big data’s still fairly limited impact in operational systems not a knock on MapR.

Their vision statement is simple: “Empowering the As-it-happens business by speeding up the data-to-action cycle.” Note the key: Hadoop is batch oriented and all the players realize that real-time analysis matters for some key sales and marketing applications. Companies are now focusing on how fast they can get information out of the databases, not what it takes to get data in. A smart move but only half the equation.

One key part of the move to package open source into something trusted was pointed out by Steve Wooledge. When the company polled customers about why they chose MapR, the largest response was availability, the up time of the system. Better performance wasn’t far behind, but it’s clear that the company understands that availability is a critical business issue and they seem to be addressing it well.

Where the déjà vu hits in a not-so-positive way is the regular refrain of technologists still not quite getting business – even when they try. This isn’t a technology problem but an innovator’s problem. When you get so wrapped up in the cool things you’re doing, you think that you need to lead with the cool things, not necessarily what the market wants.

One example was when they were describing the complexity of the MapR packaging. Almost all the focus was on the cool buzzwords of open source. Almost lost in the mix was the mention that their software supports NFS. It was developed more than 30 years ago and helps find files on networks. That MapR helps link both the latest and the still voluminous data in existing file systems is a key point, something that can help businesses understand that Hadoop can be integrated into existing systems and infrastructure. However, it’s not cool so the information is buried.

The final thing I’ll mention about the existing products is that MapR has built a nice three product suite, providing open source, mid-tier and full enterprise versions. That’s the perfect way to address the open source conundrum and move folks along the customer curve.

Apache Drill: Has it Bitten Off Too Much?

Sorry, couldn’t help the drill bit reference. Tomer Shiran took the later part of the presentation to show off Apache’s latest data toy, Apache Drill, intended to bridge the two worlds of data. The problem I saw was one not limited to Tomer, MapR or even Apache, but to all folks with with what they think of as new technology: Over hype and an addiction to revolutionary rather than evolutionary words and messages. There were far too many phrases that denigrated IT and existing technology and implied Drill would replace things that weren’t needed. When questioned, Tomer admitted that it’s a compliment; but the unthinking words of many folks in the industry set out a pattern inimical to rapid adoption into the Global 1000’s critical information paths.

Backing up that was a reply given to one questioner: ““CIO of one of the largest tech companies said they can’t keep doing things the same way.” Tech companies tend to be bleeding edge by nature, they do not represent the fuller business world. More importantly, the idea that a CIO saying she needs to change doesn’t mean the CIO is planning on throwing out existing tools that work. It means she wants to expand and extend in a way to leverage all technology to provide better decision making capabilities to the rest of the CxO suite.

Another area of his talk finally brought forward, through a very robust discussion, of one terminology issue that many are having. Big data folks like to talk about “no schema” but that’s not really true. Even when they modify the statement to be “schema on read” it’s missing the point.

They seem to be confusing fixed layout, relational records with the theory of schemas. XML is a schema for data exchange. It’s very flexible and can be self-defined, but it’s a schema. As it came from SGML, it’s not even the first iteration of flexible schemas. The example Mr. Tomer gave was just like an XML schema. Both data source and data recipient have to know some basic information such as field names in order to make sense of data, so there’s a schema.

Flexible schemas not only aren’t new, they don’t obviate the need for flexible schemas. They’re just another technique for managing the wide variety of data that business wishes to turn into information. As long as big data folks misusing a term and acting as if they have something revolutionary, the longer they’ll retard their needed incursion into IT and business information.

Summary

Hadoop and big data aren’t going anywhere except forward. The question is at what speed. There are some great things happening in both the Apache open source world and MapR’s licensed support for that world, but the lack of understanding of existing IT and business is retarding adoption of the new and exciting technologies.

When statements such as “But the sales guy won’t do X” are used by folks who have never been in and don’t understand sales, they’re missing the market. Today’s sales person is looking for faster and more accurate information, and is using many tools people would have said the same thing about only ten years earlier. In the meantime, sales management and the CxO suite who provide guidance for the sales force are even more interested in big picture information coming from massaging large data sources.

The folks in the new arenas such as Hadoop need to realize that they are complementary to existing technologies and that can help both IT and business. When pointing that out, I was asked by one of the presenters if that meant he should do two case studies, one with Hadoop, flexible schema and one with old line uses, I gave a clear no. It should be one with new and one that shows new and existing data sources combining to give management a more holistic picture than previously possible.

Evolution is good. MapR can help. They need to do the tough part of technology and more their view from what they think is cool to what the market thinks is needed.

Review: TDWI Advanced Analytics Best Practices Report and Webinar

This Tuesday, Fern Halper of the TDWI gave a talk on next generation analytics in order to push the latest TDWI report on the topic. I’ll be bouncing between the webinar and the report during this blog entry, but the report is the source for the webinar so use it as the basis. While there were some great nuggets in the study, let’s start off with the overblown title.

As Ms. Halper notes in the executive summary of the report, “Next-generation platforms and analytics often mean simply pushing past reports and dashboards to more advanced forms of analytics, such as predictive analytics.” In other words, anyone doing anything new can define that they’re using next generation analytics, so it doesn’t mean much.

This report is better than a number of others I’ve seen from the TDWI for another thing early in it: The demographics. The positions of respondents seems to be far more balanced between IT and non-IT than others and it lends the report more credibility when discussing business intelligence that matters to business.

The first statistic of note from the webinar is when we were told that 40% of respondents already use advanced analytics. Let’s deal with the bigger number: 60% of respondents, supposedly the cream of the crop who respond to TDWI, are still using basic reporting. That clearly points to a slower adoption than many in the industry acknowledge.

A major part of the reason for that is an inability to build business messages for newer applications and therefore an inability for techies to get the dollars to purchase the new systems. I talk about that a lot in my blog, wonderful technology that gets only slowly adopted because technical messages don’t interest a business audience.

Then there was the slide titled “Dashboards are the most commonly used kind of analytics.” Dashboards aren’t analytics. Dashboards are a way to display analytics. However, as it takes a technology to create dashboards to hold analytics containers, technical folks think technically and get fuzzy. Many of the newer analytics tools, including many providing predictive analytics, embed the new analytics along with others inside dashboards.

One key slide, that might seem obvious but is very important, is about the areas where next generation analytics are being adopted. The top areas are, in order:

  • Marketing
  • Executive management
  • Sales
  • Finance

Two of the first three are focused on top line business, revenue, while the other two have to balance top and bottom line. Yes, operations matters and some of those areas aren’t far behind, but the numbers mean something I’ve repeated and will continue to repeat: Techies need to understand the pressures, needs and communications styles of folks they don’t often understand, and must create stories that address those people. If you take anything from the TDWI report, take that.

One pair of subjects in the talk made me shake my head.

First, the top three groups of people using advanced analytics in companies:

  • Business Analysts: 75%
  • Data Scientists: 56%
  • Business Users: 50%

We can see the weight of need overbalanced to business categories, not the mystically names and overpriced data scientist.

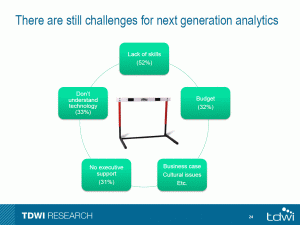
The report has a very good summary of how respondents are trying to overcome the challenges of adopting the new BI solutions (page 22, worth downloading the report). Gaining skills is the first part of that and some folks claim their way of doing it is to “Hir[e] fewer but more skilled personnel such as data analysts and data scientists.” Those are probably the folks in the middle bullet above, who think that a priesthood can solve the problem rather than the most likely solution of providing skills and education to the folks who need to use the information.

TDWI Webinar - Advanced Analytics - Challenges

Fern Halper was very clear about that, even though she’s a data scientist. She pointed out that while executives don’t need to learn how to build models they do need to understand what the new models need and how to use them. While I think that dismisses the capabilities of many executives, it does bring the information forward. The business analysts are going to work with management to create real models that address real world problems. Specialist statistical programmers might be needed for very complex issues, but most of those people will be hired by the BI vendors.

Q&A, to be honest, hit on a problem with TDWI webinars. There were a couple of business questions, but the overwhelming number of questions were clearly from students looking for study and career advice. That leads to a question about the demographics of the audience and how TDWI should handle future webinars. If they want the audience to be business people, they need to market it better and focus on business issues. That means from the reports all the way to Q&A. Yes, TDWI is about technologies that can help business, but adoption will remain slow while the focus is on the former and not the later.

Summary

The latest TWDI Best Practices Report has some interesting information to describe the slow adoption of advanced BI into the marketplace. It has some great nuggets to help vendors focus better on a business audience and suggest IT needs to also pay more attention to their users, and it’s more balanced than other recent reports. However, the presentation of the information still makes the same mistake as that made by many vendors – it’s not creating the clear, overarching business message needed to speed adoption.

If you missed the presentation, don’t both with watching on-demand. However, download the report, it’s worth the read.

Teleran at BBBT: Great technology, again with the message…

The BBBT started off 2015 with yet another company with a great technology and far too simplistic strategy and message. It’s the old problem: Lots of folks come to the BBBT because their small companies are starting to get traction and they want wider exposure, but the management doesn’t really understand Moore’s Chasm so are still pitching to their early adopters rather than the larger market.

Friday’s presenter was Kevin Courtney, VP Business Solutions, Teleran. Back in the day, I evaluated a small technology company for acquisition of their technology and inclusion into Mercury Interactive’s testing suite. It was an SQL inspector that let our products see the transactions going between clients and servers to help improve performance testing.

Teleran has the same basics but has come much further in recent years. The company starts with the same technology but has layered great analytics on top in order to help companies understand database usage in order to optimize application and network performance. They’ve broken down the issues into three key areas of business concern:

  • Performance and value: How are queries being performed in order to minimize dead data transfer and increase the value of existing computing infrastructure.
  • Risk and Compliance: Understanding who is doing what with data in order to minimize risk and prove regulatory and contract compliance.
  • Modernization, migration.re-platforming: Understanding existing loads, transactions and queries in order to better prepare for upgrading to new technologies – both hardware and software.

In support of these capabilities, Kevin mentioned that they have 8 software patents. While my understanding of patent, trademark and copyright laws leads me to understand that software patents shouldn’t be legal, they are and the patents do show innovation in the field. Hopefully.

Mr. Courtney also did a good job giving stories that supported each of these areas. I’ll quickly describe my two favorite (I know, three bullets, but that’s life).

One example showed that value is more than just a dollar value. He described a financial trading house using Teleran to analyze the different technology and data usage patterns between their top and bottom performing agents, then used that analysis to provide training to the bottom tranche (yes, I did have to use that word while discussing finance) in order to improve their performance.

The second example combined performance and modernization. He described a company where there were seven unsanctioned data marts pulling full data sets from operational systems. That had a severely negative impact on performance throughout their infrastructure. The understanding of those systems allowed for planning to consolidate, upgrade and modernize their business intelligence infrastructure.

So what’s the issue?

They have a great product suite, but what about strategy? The discussion, with additional information from Chris Doolittle, VP Marketing, via phone, is that they have a system that isn’t cheap and they readily admit they have trouble proving their own value.

Take a look at the Teleran site. Download some case studies. What you see is lots and lots of discussion about the technology. However, even when they do discuss some of the great stories they told us, the business value is still buried in the text. They’re still selling to IT and not providing IT the clear information needed to convince the business users to write the checks.

What’s needed is the typical chasm move of turning things upside down. They need to overhaul their message. They need to boldly lead with the business value and discuss how it’s provided only after describing that value.

What’s also needed is something that will be even harder: Changing the product in synchronization with the message. The demonstration showed a product that has little thought put into the user interface. At one point, Kevin said, after going through four different tables, “if you take x, y and z, then you can see that…” Well, that needs to be clear in a business intelligence driven interface rather than having the pieces scattered around requiring additional information or thought to figure it out. It’s overcrowded, very tabular and dashboards aren’t really dashboards. They need to contract with or hire some UI experts to rethink their interface.

They do OEM Qlik, but there are two problems with that. It looks like they’re using a very old version and aren’t taking advantage of Qlik’s modern BI toolsets. Also, the window with the information has a completely Qlik title. It should read Teleran’s product powered by Qlik in order to keep context.

Summary

Teleran is another company with a great technology that needs to change in order to cross the chasm. Their advantage is that their space, performance analysis, is far less crowded than the database or BI end points. If they can clarify their products and messages, they can carve out a very nice chunk of the market.

Denodo at BBBT: Data Virtualization, an Important Niche

Data virtualization. What is it? A few companies have picked up the term and run with it, including last week’s BBBT presenter Denodo. The presentation team was Suresh Chandrasekaran, Sr. VP, North America, Paul Moxon, Sr. Director, Product Management & Solution Architecture, and Pablo Alvarez, Sales Engineer. Still, what I’ve not seen is a clear definition of the phrase. The Denodo team did a good job describing their successes and some features that help that, but they do avoiding a clear definition.

Data Virtualization

The companies doing data virtualization are working to create a virtual data structure where the logical definitions link back to disparate live systems instead of overlaying a single aggregated database of information. It’s the concept of a federated data warehouse from the 1990s, extended past the warehouse and now more functional because of technology improvements.

Data virtualization (and note that, sadly, I don’t create an acronym because DV is also data visualization and who needs the confusion. So more typing…) is sometimes thought of as a way to avoid data warehouses by people who hear about it at a high level, but as the Denodo team repeatedly pointed out, that’s not the case. Virtualization can simplify and speed some types of analysis, but the need for aggregated data stores isn’t going away.

The biggest problem with virtualization for everything is operational systems not being able to handle the performance hits of lots of queries. A second is that operational systems don’t typically track historical information needed for business analysis. Another is that very static data in multiple systems that’s accessed frequently can create an unnecessary load on today’s busier and busier networks. Consolidating information can simplify and speed access. Another is that change management becomes a major issue, with changes to one small system potentially causing changes to many systems and reports. There are others, but they in no way undermine the value that is virtualization.

As Pablo Alvarez discussed, virtualization and a warehouse can work well together to help companies blend data of different latencies, with virtualization bringing in dynamic data to mesh with historic and dimensional information to provide the big picture.

Denodo

Denodo seems to have a very good product for virtualization. However, as I keep pointing out when listening to the smaller companies, they haven’t yet meshed their high level ideas about virtualization and their products into a clear message. The supposed marketechture slide presented by Suresh Chandrasekaran was very technical, not strategic. Where he really made a point was in discussing what makes a Denodo pitch successful.

Mr. Chandrasekaran states that pure business intelligence (BI) sales are a weak pitch for data virtualization and that a broader data need is where the value is seen by IT. That makes absolute sense as the blend between BI and real-time is just starting and BI tends to look at longer latency data. It’s the firms that are accessing a lot of disparate systems for all types of productivity and business analysis past the focus on BI who want to get to those disparate systems as easily as possible. That’s Denodo’s sweet spot.

While their high level message isn’t yet clarified or meshed with markets and products, their product marketing seems to be right on track. They’ve created a very nicely scaled product

Denodo Express is free version of their platform. Paul Moxon stated that it’s fully functional, but it can’t be clustered, has a limitation of result set size and can’t access certain data sources. However, it’s a great way for prospects to look at the functionality of the product and to build a proof-of-concept. The other great idea is that Denodo gives Express users a fixed time pricing offer for enterprise licensing. While not providing numbers, Suresh stated that the offer was working well as an incentive for the freeware to not be shelfware, for prospects to test and move down the sales funnel. To be blunt, I think that’s a great model.

One area they know is a weakness is in services, both professional services and support. That’s always an issue with a rapidly growing company and it’s good to see Denodo acknowledge that and talk about how they’re working to mitigate issues. The team said there are plans to expand their capital base next year, and I’d expect a chunk of that investment to go towards this area.

The final thing I’ll note specifically about Denodo’s presentation is their customer slides. That section had success stories presented by the customers, their own views. That was a strong way to show customer buy in but a weak way to show clear value. Each slide was very different, many were overly complex and most didn’t clearly show the value they achieved. It’s nice, but customer stories need to be better formalized.

Data Virtualization as a Market

As pointed out above, in the description of virtualization, it’s a very valuable tool. The market question is simple: Is that enough? There have been plenty of tools that eventually became part of a larger market or a feature in a larger product offering. What about data virtualization?

As the Denodo team seems to admit, data virtualization isn’t a market that can stand on its own. It must integrate with other data access, storage and provisioning systems to provide a whole to companies looking to better understand and manage their businesses. When there’s a new point solution, a tool, partnerships always work well early in the market. Denodo is doing a good job with partners to provide a robust solution to companies; but at some point bigger players don’t want to partner but to provide a complete solution.

That means data virtualization companies are going to need to spread into other areas or be acquired. Suresh Chandrasekaran thinks that data virtualization is now at the tipping point of acceptance. In my book, given how fast the software industry, in general, and data infrastructure markets, in particular, grow and evolve, that leaves a few years of very focused growth before the serious acquisitions happen – though I wouldn’t be surprised if it starts sooner. That means companies need to be looking both at near term details and long term changes to the industry.

When I asked about long term strategy, I got the typical startup answer: They’re focused on internal growth rather than acquisition (either direction). That’s a good external message because folks who want a leading edge company want it clear that they’re using a leading edge company, but I hope the internal conversations at the CxO level aren’t avoiding acquisition. That’s not a failure, just a different version of success.

Summary

Denodo is a strong technical company focused on data virtualization in the short run. They have a very nicely scaled model from Denodo Express to their full product. They seem to understand their sweet spot within IT organizations. Given that, any large organization looking to get better access to disparate sources of data should talk with Denodo as part of their evaluation process.

My only questions are in marketing messages and whether or not Denodo be able to change from a technical sales to a higher level, clearer vision that will help them cross the chasm. If not, I don’t think their product is going anywhere, someone will acquire them. Regardless, Denodo seems to be a strong choice to look at to address data access and integration issues.

Data virtualization is an important niche, the questions remain as to how large is the niche and how long it will remain independent.

Data Governance and Self-Service Business Intelligence: History Repeating?

Self-Service BI is a big buzz phrase these days even though many definitions exist. However, one thing is clear: It’s driving another challenge in the area of data governance. While people are starting to talk about this, it’s important to leverage what we’ve learned from the past. Too many technology industry folks are so enamored by the latest piece of software or hardware that they convince themselves their solutions are so new they are revolutionary, “have no competitors” or otherwise rationalize context. However, the smart people won’t do that.

A Quick History Lesson: The PC

In 1982, I was an operator at one of Tymshare’s big iron floors. It was a Sunday and I was reading my paper sitting at the console of an IBM 370/3033, their top of the line business computer. An article in the business section was an article titled something like “IBM announces their 370 on a chip.” I looked up at my behemoth, looked back at the article and new things would change.

Along came the PC. Corporate divisions and departments frustrated at not getting enough resources from the always understaffed, under financed and overburdened IT staff jumped on the craze. Out with the IBM Selectric and in with the IBM AT and its successors and clones.

However, by the end of the decade and early in the 1990s, corporate executives realized they had a problem. While it was great that each office was becoming more productive, the results weren’t as helpful. It’s a lot harder to roll-up divisional sales data when each territory has a slightly different definition of their territories, lead and funnels. It’s hard to make manufacturing budget forecasts when inventory is stored in different formats and might use different aging criteria. It’s hard to show a government agency you’re in regulatory compliance when the data in in multiple and non-integrated systems.

Data governance had been lost. The next twenty years saw the growth of client server software such as that by Oracle and SAP, working to link all offices to the same data structures and metadata while still working to leave enough independence. That balance between centralized IT control and decentralized freedom of action is still being worked out but is necessary.

While the phrase “single version of truth” is often mistakenly applied to mean a data warehouse and a “single source of truth,” that’s not what it means. A single version of the truth means shared data and metadata that ensures that all parties looking at the same data come up with the same information – if not the same conclusions from that information.

Now: Self-Service BI

Look at the history of the BI market. There have always been reports. With the advent of the PC, we had the de facto standard of Crystal Reports for a generation. Then, as the growth of packaged ERP, CRM, SFA and other systems came along, so did companies such as Cognos and Business Objects to focus on more complex analysis. However, they were still bound by the client/server model that was tied primarily to mid-tier Unix servers and Microsoft/Apple PCs.

What’s changed now are the evolution of the internet into the Cloud and phones into smartphones and tablets. Where divisions and departments were once leashed to big iron and CICS screens, divisions who have been more recently tied to desktops are feeling their oats and interested in quickly developing their own applications that allow their knowledge workers to access information while not seated in the office.

Self-Service BI (And, no, I’m not going to make an acronym as many have. Don’t we have enough?) is the PC of this decade. It’s letting organizations get information to people without waiting for IT, who’s still underfunded, understaffed and overburdened, distribute information widely. Alas, that wide distribution comes without controls and without audit trails. Data governance is again being challenged.

I’ve listened to a number of presentations by vendors to the BBBT, and there is hope. Gone are the days when all BI companies talked about was in helping business people avoid using IT. There’s more talk about metadata, more interest in security and access control, and a better ability to provide audit trails. There’s an understanding that it’s great to allow every knowledge worker to look at the data and understand those pieces of information arising that address their needs while still ensuring that the base data is consistent and metadata is shared.

Summary

We can learn from history. The PC was a great experiment in watching the pendulum swing from almost complete IT control to almost no IT control then back to a more reasonable middle. The BI community shows signs of learning from history and making a much faster switch to the middle ground. That’s a great thing.

Technologists working to help businesses improve performance through data, BI and analytics need to remember the great quote from Daniel Patrick Moynihan, “Everyone is entitled to his own opinion, but not his own facts.”

Tableau Software Analyst Briefing: Mid-size BI success and focus on the future

Yesterday, Tableau Software held an analyst briefing. It wasn’t a high level one, it was really just a webinar where they covered some product futures under NDA. However, it was very unclear what was NDA and what wasn’t. When they discussed things announced at the most recent Tableau Conference in Seattle, that’s not NDA, but there was plenty of future discussed, so I’ll walk a fine line.

The first news is to cover their Third Quarter announcement from the beginning of the month. This was Tableau’s first quarter of over $100 million in recognized revenue. It’s a strong showing and they’re justifiable proud of their consistent growth.

Ajay Chandrdamouly, Analyst Relations, also said that the growth primarily results from a Land and Expand strategy, beginning with small jobs in departments or divisions, driven by business needs, then expanding into other organizations and eventually into a corporate IT account position. However, one interesting point is an expansion mentioned later in the presentation by Francois Ajenstat, Product Management, while giving the usual case studies seen in such presentations. He did a good job of showing one case study that was Land and Expand, but another began as a corporate IT account and usage was driven outward by that. It’s an indication of the maturity of both Tableau and the business intelligence (BI) market that more and more BI initiatives are being driven by IT at the start.

Francois’ main presentation was about releases, past and future. While I can’t write about the later, I’ll mention one concern based on the former. He was very proud about the large number of frequent updates Tableau has released. That’s ok in the Cloud, where releases are quickly rolled into the product that everyone uses. However, that’s a risk in on-premises (yes, Francois, the final S is needed) installations in the area of support. How long do you support products and how do you support them is an issue. Your support team has to know a large number of variations to provide quick results or must investigate and study each time, slowing responses and possibly angering customers. I asked about the product lifecycle and how they managed to support and to decide sunsetting issues, but I did not get a clear and useful answer.

The presentation Mr. Ajenstat gave listed six major focus themes for Tableau, and that’s worth mentioning here:

  • Seamless Access to Data
  • Analytics & Statistics for Everyone
  • Visual Analytics Everywhere
  • Storytelling
  • Enterprise
  • Fast, Easy, Beautiful

None of those is a surprise, nor is the fact that they’re trying to build a consistent whole from the combination of foci. The fun was the NDA preview of how they’re working on all of those in the next release. One bit of foreshadowing, they are looking at some issues that won’t minimize enterprise products but will be aimed at a non-enterprise audience. They’ll have to be careful how they balance the two but expansion done right brings a wider audience so can be a good thing.

The final presenter was Ellie Fields, Product Marketing, who talked more about solution than product. Tableau Drive is not something to do with storage or big data, it’s a poorly named but well thought out methodology for BI projects. Industry firms are finally admitting they need some consistency in implementation and so are providing best practices to their implementation partners and customers to improve success rates, speed implementation and save costs. Modern software is complex, as are business issues, so BI firms have to provide a combination of products and services that help in the real world. Tableau Drive is a new attempt by the company to do just that. There’s also no surprise that it uses the word agile, since that’s the current buzzword for iterative development that’s been going on long before the word was applied. As I’m not one who’s implemented BI product, I won’t speak to its effectiveness, but Drive is a necessity in the marketplace and Tableau Drive helps provide a complete solution.

Summary

The briefing was a technical analyst presentation by Tableau about the current state of the company and some of its futures. There was nothing special, no stunning revelations, but that’s not a problem. The team’s message is that the company has been growing steadily and well and that their plans for the future are set forward to continue that growth. They are now a mid-size company, no longer as nimble as startups yet don’t have the weight of the really large firms, they have to chart a careful path to continue their success. So far it seems they are doing so.