Tag Archives: actuate

TDWI Webinar: Embedded Analytics

The latest TDWI webinar was on embedded analytics. The speakers were Fern Halper, the director of TDWI research for advanced analytics, and Mark Gamble from OpenText. For those of you who hadn’t heard, Actuate was acquired by OpenText and is being rebranded but, according to Mark, will remain an independent division for now.

Ms. Halper’s main point is that embedded has a lot of different meanings for different audiences and that she wants to create a clear framework for understanding the terminology within the analytics space. She’s clear that what’s meant isn’t just into the mass market idea of wearable software, but that analytics can be embedded in specific applications, broader systems and, yes, devices such as mobile and wearable items.

Early in the presentation she presented a two axis image comparing structured and unstructured data combined with human and machine generated data. While I think the coloring should rotate, to emphasize that the difference between machine versus human generated information is a bigger issue than structured v unstructured, it’s a nice way of understanding some of the data streams.

TDWI Embedded Analytics - Data Sources

That, however, was a definitional slide and discussion. The real mean of Fern Halper’s presentation was the framework she described to help understand the steps of embedding analytics.

TDWI Embedded Analytics - Framework

Operationalized analytics are those that are involved in the full process of decision making. For instance, a call center employee might be talking to a prospect whose finances are flagged as a question mark. That prospect must be sent to another person to process the decision based on analytics.

Integrated analytics are those that allow the call center operator to see the analysis and immediately make decisions based upon guidelines.

Automated analytics are those that provide the operator with a decision tree response based on analytics done behind the scenes.

The only issue I take with the framework is it doesn’t necessarily mean true real time. The example discussed shows that the integrated approach can be real time for what humans think of as real time within our own interactions. Meanwhile, real-time might not be a necessary component to some automated decisions. Real-time is a separate issue and I think Fern’s framework would be better served by eliminating that item.

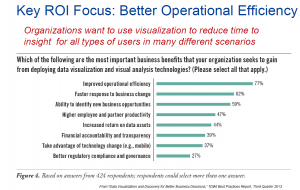
Fern Halper followed the framework with the usual and interesting TDWI survey numbers. This time, the questions were focused on the adoption of analytics tied to the framework. The numbers showed the unsurprising fact that analytics adoption is still in its infancy. One of the great parts of TDWI’s numbers is they show the reality which contradicts the industry’s hype.

One set of numbers I’d like to see wasn’t included. The responses were only IT responses in general, who has started using what analytics. I would have loved to see one slide that clearly showed only the sub-segment of companies who are already using analytics tools and where those companies are within Ms. Halper’s framework. Are are the bleeding edge folks doing at moving through the framework to automated solutions?

OpenText

The rest of the program was a fast presentation by Mark Gamble, pointing to OpenText’s (Actuate’s) main benefit claim of enterprise scalability and the other factors. One of the phrases I liked was his reference stating they “adhered to a low code methodology.” It’s nice to hear folks admitting that as much as we want to eliminate coding, some of that is still required. Honesty isn’t a negative in marketing and I liked that turn of phrase.

In the other direction, he mentioned there were over fourteen million downloads of BIRT and that the company “believes” they have over three million users. I’m not interested in belief but they don’t seem to have a clear figure on adoption.

The main problem I had was the demo. Mark showed experimental work positing to show live acquisition of basic automotive information such as speed and RPM displayed on a computer, phone and watch. It was not only not a business case but one that seemed to go back to the misunderstanding about the meaning of embedded which was addressed by Fern. Yes, it was embedded on two devices, but the demo didn’t show how it might be embedded in business applications. It stuck with the flashy concept of wearables.

OpenText might have something good with their analytics portability, but I don’t think the demo presents it to a business audience. Yes, techies will understand the underpinnings that make it cool, but the business folks writing checks need to see something that justifies the expenditure and I don’t think that’s shown.

Summary

Fern Halper did another good job of putting the adoption of analytics into perspective. This time, with a framework for better understanding embedded analytics.

Mark Gamble did a passable job of presenting OpenText’s solution but I feel he must do a better job of figuring out a business message.

TDWI’s data shows the early state of adoption that exists in the market. Fern Halper’s framework will help companies better understand how to move into the arena, but only if the companies providing those solutions can better present how they’ll help solve business issues.

TDWI / Actuate Webinar on Visualization: Not much there

Maybe it’s because of the TDWI conference now going on in San Diego, but this morning’s webinar on “Making Data Beautiful for Business Users” seemed a bit of an afterthought. The presenters were Dave Stodder, TDWI Director of Research, and Allen Bonde, VP Product Marketing and Innovation, Actuate. There were a few interesting moments, but not a lot of even basic content.

Dave Stodder began with a whole bunch of quotes from other people. I admit, it’s a quick way to put together a presentation, but then you should paraphrase and explain why the quotes matter rather than just reading them verbatim – we, the audience, are already doing that.

However, then he got to the three main goals of improving visualization in BI:

  • Improving self-service
  • Shortening the path to insight
  • Advancing business agility

To be honest, those are accurate but also valid for every other point in reporting throughout history. Businesses always want to enable decision makers to help make more accurate and timely decisions through better information.

What followed was one of the keys to TDWI success: An interesting slide based on one of their surveys.TDWI Visualization ROI Focus slide

Improved operational efficiency was a clear number one. The problem is that the data is most likely from IT respondents rather than from business users. I asked the question about that but it wasn’t answered. I predict that if you asked business users you’d find the second two items, faster response and identify new opportunities, would be at the top.

One important point Dave Stodder made was about alert fatigue. It’s tempting to have visualizations and other tactics that alert anytime things change, but too many alerts mean people stop paying attention. It reminded me of my days as a sales engineer, back in the days of pagers. Another SE and I had to sit down one of the sales people and explain that if he appended 911 to every page then nothing was important.

The only part purely focused on visualizations were two slides. One was just a collection of a few visualization types and the other was another TDWI survey about which visualization types are currently being implemented. There wasn’t a discussion of the appropriateness of the ones being used the most, any reason to better focus on some being ignored, or any discussion about how many are provided by packaged BI tools versus are home grown by the supposedly valuable data scientists.

Allen Bonde then took over and didn’t focus on visualization. He gave a rather generic Actuate sales pitch, mentioning platforms built for scale, the importance of an open community and didn’t show any visuals on visualization.

It wasn’t that the presentation was terrible, it’s only that it was far too generic. What was said about visualizations could be said about just about any reporting and there wasn’t really any direct focus on visualization. It’s one thing to quote Tufte, it’s another to have a discussion about current tools and what’s coming. That later was missed.

Maybe after the conference we’ll see another webinar with clearer focus.

Webinar: IBM, Actuate and Cirro describe faster analytics

Today a webinar was hosted by Database Trend and Applications. While there are important things to talk about, I’ll start with the amusing point of the inverse relationship between company size and presenter title found in every webinar, but wonderfully on display here. The three presenters were:

  • Mark Theissen, CEO, Cirro
  • Peter Hoopes, VP/GM, BIRT Analytics Division, Actuate
  • Amit Patel, Program Director, Data Warehouse Solutions Marketing, IBM

The topic was “Accelerating your Analytics for Faster Insights.” That is a lot to cover in less than an hour, made more brief by a tag team of three people from different companies. I must say I was pleasantly surprised with how well they integrated their messages.

Mark Theissen was up first. There were a lot of fancy names for what Cirro does, but think ETL as it’s much easier. Mark’s point is that no single repository can handle all enterprise data even if that made sense. Cirro’s goal is to provide on-demand distributed analytics, using federation to link multiple data sources in order to help businesses analyze more complete information. It’s a strong point people have forgotten in the last few years during the typical “the latest craze will solve everything” focus on Hadoop and minimizing the role of getting to multiple sources.

Peter Hoopes then followed to talk about doing the analytics. One phrase he used should be discussed in more detail: “speed wins.” So many people are focused on the admittedly important area of immediate retail feedback on the web and with mobile devices. There, yes, speed can win. However, not always. Sometimes though helps too. That’s one reason why complex analysis for high level business strategy and planning is different that putting an ad on a phone as you walk by a store. There are clear reasons for speed, even in analytics, but it should not be the only focus in a BI decision.

IBM’s Amit Patel then came on to discuss the meat of the matter: DB2 Blu. This is IBM’s foray into in-memory, columnar databases. It’s a critical ad to the product line. There are advantages to in-memory that have created a need for all major players to have an offering, and IBM does the “me too!” well; but how does IBM differentiate itself?

As someone who understands the need for integration of transaction and analytic systems and agrees both need to co-exist, I was intrigued by what Amit had to say. Transactions going into normal DB2 environment while being shadowed into columnar BLU environment to speed analytics. Think about it: Transactions can still be managed with the row-oriented technologies best suited for them while the information is, in parallel, moved to the analytics database that happens to be in memory. It seems to be a good way to begin to blend the technologies and let each do what works best.

For a slightly techhie comment, I did like what Mr. Patel was saying about IBM’s management of memory and CPU. After all, while IBM is one of the largest software vendors in the world, too many folks forget their hardware background. One quick mention in a sentence about “hardware vendors such as Intel and IBM…” was a great touch to add a message that can help IBM differentiate its knowledge of MPP from that of pure software companies. As a marketing guy, I smiled big time at the smooth way that was brought up.

Summary

The three presenters did a good job in pointing out that the heterogeneous nature of enterprise data isn’t going away, rather it’s expanding. Each company, in its own way, put forward how it helps address that complexity. Still, it takes three companies.

As the BI market continues to mature, the companies who manage to combine the enterprise information supply chain components most smoothly will succeed. Right now, there’s a message being presented by three players. Other competitors also partner for ETL, data storage and analytics. It sounds interesting, but the market’s still young. Look for more robust messages from single vendors to evolve.