Maybe it’s because of the TDWI conference now going on in San Diego, but this morning’s webinar on “Making Data Beautiful for Business Users” seemed a bit of an afterthought. The presenters were Dave Stodder, TDWI Director of Research, and Allen Bonde, VP Product Marketing and Innovation, Actuate. There were a few interesting moments, but not a lot of even basic content.
Dave Stodder began with a whole bunch of quotes from other people. I admit, it’s a quick way to put together a presentation, but then you should paraphrase and explain why the quotes matter rather than just reading them verbatim – we, the audience, are already doing that.
However, then he got to the three main goals of improving visualization in BI:
- Improving self-service
- Shortening the path to insight
- Advancing business agility
To be honest, those are accurate but also valid for every other point in reporting throughout history. Businesses always want to enable decision makers to help make more accurate and timely decisions through better information.
What followed was one of the keys to TDWI success: An interesting slide based on one of their surveys.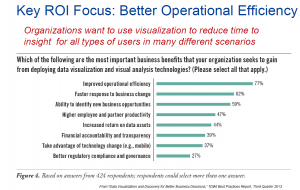
Improved operational efficiency was a clear number one. The problem is that the data is most likely from IT respondents rather than from business users. I asked the question about that but it wasn’t answered. I predict that if you asked business users you’d find the second two items, faster response and identify new opportunities, would be at the top.
One important point Dave Stodder made was about alert fatigue. It’s tempting to have visualizations and other tactics that alert anytime things change, but too many alerts mean people stop paying attention. It reminded me of my days as a sales engineer, back in the days of pagers. Another SE and I had to sit down one of the sales people and explain that if he appended 911 to every page then nothing was important.
The only part purely focused on visualizations were two slides. One was just a collection of a few visualization types and the other was another TDWI survey about which visualization types are currently being implemented. There wasn’t a discussion of the appropriateness of the ones being used the most, any reason to better focus on some being ignored, or any discussion about how many are provided by packaged BI tools versus are home grown by the supposedly valuable data scientists.
Allen Bonde then took over and didn’t focus on visualization. He gave a rather generic Actuate sales pitch, mentioning platforms built for scale, the importance of an open community and didn’t show any visuals on visualization.
It wasn’t that the presentation was terrible, it’s only that it was far too generic. What was said about visualizations could be said about just about any reporting and there wasn’t really any direct focus on visualization. It’s one thing to quote Tufte, it’s another to have a discussion about current tools and what’s coming. That later was missed.
Maybe after the conference we’ll see another webinar with clearer focus.