My recent IoT article has been bundled with another by David Loshin, another analyst, by Tech Target. See it here.
Article bundled in ebook
1 Reply
My recent IoT article has been bundled with another by David Loshin, another analyst, by Tech Target. See it here.
It wasn’t my chosen title but the author was trying to make a play on words with Ike, so move past it and read my latest article on Tech Target.
Late last year, I read an article in the Harvard Business Review on disruptive innovation. I thought it needed correction and decided to post my response on LinkedIn.
This week a Brighttalk webinar based on a study driven by Holger Schulze occurred. As he is the founder of the B2B Technology Marketing Community on LinkedIn, it should be no surprise that the topic was a discussion of his recently released report on B2B lead generation. The presentation was a great panel discussion, with Mr. Schulze picking out portions of the report and then the panel providing feedback. The panelists and their firms were:
The survey was done via the same LinkedIn group, so it’s a bit self-selected, but the results are still interesting. The top five trends are:
I’m a blend of data and intuition driven, so it’s nice to see what I’d expect backed up by numbers. However, in the stretch to get a list of five, the first two seem redundant.
68% of the respondents mention lead as a priority. The first thing pointed out was by Ben Swinney, who was surprised that “Improve the sales/marketing alignment” was down at number four. Ben was the one customer in a group of vendors and that opinion has a lot of weight.
Fortunately for the vendors, he wasn’t in a void. The rest of the panel kept coming back to the importance of both marketing and sales working closely in order to ensure leads were recognized the same way and had consistent treatment. I agree that is necessary for improving lead quality and if there’s one key point to take from the presentation, it is improving that relationship.
Another intriguing piece of information is the return of the prioritization of conferences, had dropped to third last year and are back up to number one. Sue Yanovitch was happy, as I’m sure all IDG folks are, and pointed out their research shows that tech decision makers value their peers and so sharing information in such forums are valuable. Enterprise sales often need to lead with success stories, because most companies don’t wish to be “bleeding edge.” Conferences are always great forum for getting not only improved understanding of technology but also for people so see how others with similar backgrounds are proceeding. The increase in budgets as the markets continue to recover leads to the return of attendance to such forums.
A key point in the proper handling of leads was brought up by Dale Underwood. His company’s research shows that people have completed 60-70% of their research before there’s a formal lead request put in to a prospective vendor. That implies both better tracking and handling of touch points such as web visits, but also means that sales needs to be better informed about those previous touch points. If not, sales can’t properly prepare for that first call.
That leads into another major point. Too many technology marketing people get as enamored of product as do the founders and developers. As Dallas Jessup rightly pointed out, lead generation techniques should focus on the prospect not on the vendor. What pains are the market trying to solve? That leads to the right calls to action.
To wrap back around to the sale and marketing issue, the final point to mention came during Q&A, with a simple question of whether turning leads into customers is marketing’s or sales’ responsibility. That should never have been a question, but rather how the two achieve it would have been better.
Sue began the reply by pointing out the obvious answer of “both,” though she should have said it proudly rather than saying it was a cop-out. All the other panelists chimed in with strong support that it has to be an integrated effort, the full circle lead tracking must happen.
A recent Dataversity webinar was titled “Data Model is Data Governance.” All the right words were there but they were in the wrong order. The presenters were Robert S. Seiner, KIK Consulting, and David Hay, Essential Strategies. While Robert tried to push the title, David more accurately addressed the question “Is data modeling data governance?” Both he and I agree that the simple answer is no yet they overlap in important ways.
Data modeling is understand the data, and Mr. Hay described it in the context of business by referring to the Zachman Framwork, with the management’s overview of corporate information fitting Zachman’s first row then things diving deeper into technology as you move down the rows.
What I found interesting in a webinar with that title is the following definition slide: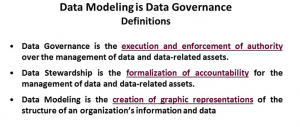
When those are your definitions, it doesn’t make sense to talk about them as being the same. David Hay regularly pointed out the same thing during the presentation and I thought his points were very useful to people considering the issue. The slide very clearly and correctly points out the different but overlapping nature of the relationship between modeling, stewardship and governance.
Towards the end of the presentation, another comparison came up that I’ve previously discussed. The topic was whether or not data modeling is an art or a science. One flaw was that David Hay seemed to be implying that the only art was in the presentation of the models to management – physical art. His belief seemed to be that the modeling was pure science. I disagree as understanding data means understanding meaning, different people often mean different things when using terms and see different things from the same information, so art is needed to mediate solutions.
My biggest annoyance with the discussion was the word that should have been discussed never made an appearance. For the same reasons I’ve argued that programmers aren’t software engineers, modeling is neither one nor the other: It is a craft. It is a blend of the two worlds of art and science. I don’t know why people today seem upset to admit to modeling and most software work as a craft, the word doesn’t denigrate the work but describes it very well.
The final point made that I thought was great was in response to a question about when to start on logical and physical models, whether that should happen before you’ve defined your business models or they need to wait. Robert Seiner accurately used the old cliché, starting the other models before you understand your business model, the thing that drives business, is to follow the failed logic of “Ready! Fire! Aim!”
Given the title, I must also say that governance was given short shrift, basically mentioned only in definition, but I didn’t really mind. While the webinar was misnamed, it was a great conversation about the relationship between data modeling and business. The conversation between the two was worth the listen.
Before I catch up on some interesting presentations, I’m going to go off topic to discuss why things have been so quiet. In a word: Sasquan! The 73rd World Science Fiction Convention (Worldcon) was held here, in beautiful Spokane, WA, USA, Earth. Wednesday through Sunday saw multiple presentations, speeches, panels, autograph sessions and other wonderful events. As a local, I volunteered from setup last Monday to move-out today. I’m tired but overjoyed.
The art show was wonderful, the vendor booth and exhibits packed, and many of the panels were standing room only. We set a record for the most attended Worldcon and had far more first time Worldcon attendees than even the most optimistic planners expected.
Along with move in and move out, I volunteered at the information desk, to keep the autograph lines moving and in many other areas. I’m exhausted but happy.
My favorite big author in the autograph sessions: Vonda McIntyre. She had a long line and stayed past her time to finish signing for all the folks who waited.
I’m not much of an autograph person myself, but as long as I was handling the lines, Joe Haldeman signed my first addition paperback of Forever War, which I bought in a used bookstore the year it came out and which has followed me around. He and his wife were very gracious and it was nice to meet them.
The Hugo Awards had a lot of controversy this year, with a very conservative group of people putting forward a slate they hoped would stop progress. What it ended up doing is causing the largest number of no awards ever in a year. However, the ceremony will more importantly leave the great image of Robert Silverberg telling the story on the 1968 event in Berkeley and then leading everyone in the Hari Krishna chant. That hilariously relieved some of the tension.
The worst note had nothing to do with the conference. Eastern Washington is on fire. Three firefighters have died (as of this writing and hopefully total this season) from the many fires in a very dry summer. There’s been a haze of ash most of the time, but Thursday was terrible, with many folks needing surgical masks to go outside. I hope we get rain soon and my best wishes to the brave fire fighters and sympathy to the families of those who died.
Now it’s time to get back to the business blogging, but that was my week.
My latest article published in Search Data Management.
http://searchdatamanagement.techtarget.com/feature/Database-schemas-still-needed-despite-Hadoop-and-NoSQL-pretensions
Trifacta is another business intelligence company to enter the horse race (yes, I know that reference is spelled differently…). They are focused on providing an early look at data coming out of Hadoop, to create some initial form and and intelligences for business use.
Last Friday, Trifacta was the presenting company at the BBBT. Their representatives were Adam Wilson, CEO, Michael Hiskey, Interim Marketing Lead, and Wei Zheng, VP Products. The presenters were there to discuss the company’s position in data wrangling. While some folks had problems with the term, as Michael Hiskey pointed out, it as term that they didn’t invent. Me? I think it makes more sense than another phrase our industry uses, data lake; but that’s another topic.
Simply put, Trifacta is working to more easily provide a view into Hadoop data by using intelligence to better understand and suggest field breaks, layouts and formats, to help users clean and refine the data in order for it to become useable information for analysis.
Michael and the others talk about self-service data preparation, implying end, business user involvement. The problem is that they’re messaging far ahead of the product. They, as lots of other companies are also doing, try too hard to imply an ease of use that isn’t there. Their users are analysts, IT or business. The product is important and useful, but it’s important to be clear about to whom it is useful. (Read more about self-service issues).
While Michael Mr. Hiskey and Mr. Wilson gave the introduction, the meat was in Ms. Zheng’s presentation. As a guy who has spent years in product marketing, I have a bit of a love hate relationship with product management. Have had some great ones and very poor ones – and I’m sure the views of me also spread that spectrum. I’ll openly say that Wei Zheng is the most impressive example of a VP of Products I’ve heard in a long time. She not only knows the products, she was very clear about understanding the market and working to bridge that to development. How could any product marketer not be impressed? Her demo was a great mix between product and discussions about both current usage and future strategy.
One of the keys to the product Wei Zheng pointed out is that the work Trifata is doing does not include moving the data. It doesn’t update the data, it works by managing metadata that describes both data and transformations. Yes, I said the word. Transformations. Think of Trifacta as simplified ETL for Hadoop, but with a focus on the E & T.
The Trifacta platform reads the Hadoop data, sampling from the full source, and uses analysis to suggest field breaks. Wei used a csv file for her demo, so I can’t speak to what mileage you’ll experience with Hadoop data, but the logic seems clear. As someone who fifteen years ago worked for a company that was analyzing row data without delimiters to find fields, I know it’s possible to get close through automation. If you’re interesting, you should definitely talk with them and have them show you their platform working with your data.
The product then displays a lot of detail about the overall data and the fields. It’s very useful information but, again, it’s going to be far more useful to a data analyst than to a business user.
Trifacta also has some basic data cleansing functions, such as setting groups for slightly different variations of the same customer company name and then changing them to something consistent. Remember, this is done in the metadata; the original data remains the same. You can review the data and the cleaned data will show, but the original remains until you formally export to a clean data file.
Finally, as the demonstration clearly shows, they aren’t trying to become a BI visualization firm. They are focused on understanding, organizing and cleaning the data before analysis can be done. They partner with visualization vendors for the end-user analytics.
Trifacta has a nifty little product for better understanding, cleaning and providing Hadoop data. Analysts should love it. The problem is that, unlike what their presentation implies, Hadoop does not equal big data. They have nothing that helps link Hadoop into the wider enterprise data market. They are a very useful tool for Hadoop, but unless they quickly move past that, other vendors are already looking at how to make sense of the full enterprise data world. They seem to have a great start in a product and, from my limited exposure to three people, a very good team. If you need help leveraging your Hadoop data, talk with them.
Clearstory Data presented to the BBBT last week. The company is presenting itself as an end-to-end BI company, providing data access through display. Their core is what they call Data Harmonization, or trying to better merge multiple data stores into a current whole.
The presentation started with Andrew Yeung, Director of Product Marketing, giving the overview slides. The company was founded by some folks from Aster Data and has about sixty people and its mission is to “Converge more data sources faster and enable frontline business users to do collaborative data exploration to ‘answer new questions.’” A key fact Andrew brought up was that 74% of business users need to access four or more data sources (from their own research). As I’ve mentioned before, the issue is more wide data than big data, and this company understands that.
If that sounds to you like ETL, you’ve got it. Everyone thinks they have to invent new terms and ETL is such an old one and has negative connotations, so they’re trying to rebrand. There’s nothing wrong with ETL, even if you rationalize its ELT or harmonization, it’s still important and the team has a good message.
The key differentiator is that they’re adding some fundamental data and metadata to improve the blending of the data sources. That will help lower the amount of IT involvement in creating the links and the resulting data store. Mr. Yeung talked about how the application inferred relationships between field based on both data and metadata to both link data sources and infer dimensions around the key data.
Andrew ended his segment with a couple of customer stories. I’ll point out that they were anonymous, always something in my book. When a firm trusts enough to let you use its name, you have a certain level of confidence. The two studies were a CPG company and a grocery chain, good indications of ClearStory’s ability to handle large data volumes.
The presentation was then taken over by Kumar Srivastava, Senior Director of Product Management, for the architecture discussion.
ClearStory is a cloud service provider, with access to corporate systems but work is done on their servers. Mr. Srivastava started by stating that the harmonization level and higher are run in-memory on Apache Spark.
That led to the immediate question of security. Kumar gave all the right assurances on basic network security and was also quick to transition to, not hide, the additional security and compliance issues that might prevent some data from being moved from inside the firewall to the cloud. He also said the company suggests clients mask critical information but ClearStory doesn’t yet provide the service. He admitted they’re a young firm and still working out those issues with their early customer. That’s a perfectly reasonable answer and if you talk with the company, be sure to discuss your compliance needs and their progress.
Mr. Srivastava also made a big deal about collaborative analytics, but it’s something everyone’s working on, he said nothing really new and the demo didn’t show it. I think collaboration is now a checklist item, folks want to know a firm has it, but aren’t sure how to use it. There’s time to grow.
The last issue discussed by Kumar was storyboards, the latest buzzword in the industry. He talked about them being different then dashboards and then showed a slide that makes them look like dashboards. During the demo, they show as more dynamic dashboards, with more flexible drilldown and easy capture of new dashboard elements. It’s very important but the storyboard paradigm is seriously overblown.
The final presenter was Scott Anderson, Sales Engineer, for the demonstration. He started by showing they don’t have a local client but just use a browser. Everyone’s moving to HTML5 so it’s another checklist item.
While much of the demo flew by far too quickly to really see how good the interface was, there was one clear positive element – though some analysts will disagree. Based on the data, ClearStory chooses an initial virtualization. The customer can change that on the fly, but there’s no need to decide at the very front what you need the data to be. Some analysts and companies claim that is bad, that you can send the user in the wrong direction. That’s why some firms still make the user select an initial virtualization. That, to me, is wrong. Quickly getting a visualization up helps the business worker begin to immediately understand the data then fine tune what is needed.
At the end of the presentation, two issues were discussed that had important relevance to the in-memory method of working with data: They’re not good with changing data. If you pull in data and display results, then new data is loaded over it, the results change with no history or provenance for the data. This is something they’ll clearly have to work on to become more robust.
The other issue is the question of usability. They claim this is for end users, but the demo only showed Scott grabbing a spreadsheet off of his own computer. When you start a presentation talking about the number of data sources needed for most analysis, you need to show how the data is accessed. The odds are, this is a tool that requires IT and business analysts for more than the simplest information. That said, the company is young, as are many in the space.
ClearStory is a young company working to provide better access and blending of disparate data sources. Their focus is definitely on the challenge of accessing and merging data. Their virtualizations are good but they also work with pure BI virtualization tools on top of their harmonization. There was nothing that wowed me but also nothing that came out as a huge concern. It was a generic presentation that didn’t show much, gave some promise but left a number of questions.
They are a startup that knows the right things to say, but it’s most likely going to be bleeding edge companies who experiment with them in the short term. If they can provide what they claim, they’ll eventually get some names references and start moving towards the main market.
As they move forward, I hope to see more.
This Tuesday, Fern Halper of the TDWI gave a talk on next generation analytics in order to push the latest TDWI report on the topic. I’ll be bouncing between the webinar and the report during this blog entry, but the report is the source for the webinar so use it as the basis. While there were some great nuggets in the study, let’s start off with the overblown title.
As Ms. Halper notes in the executive summary of the report, “Next-generation platforms and analytics often mean simply pushing past reports and dashboards to more advanced forms of analytics, such as predictive analytics.” In other words, anyone doing anything new can define that they’re using next generation analytics, so it doesn’t mean much.
This report is better than a number of others I’ve seen from the TDWI for another thing early in it: The demographics. The positions of respondents seems to be far more balanced between IT and non-IT than others and it lends the report more credibility when discussing business intelligence that matters to business.
The first statistic of note from the webinar is when we were told that 40% of respondents already use advanced analytics. Let’s deal with the bigger number: 60% of respondents, supposedly the cream of the crop who respond to TDWI, are still using basic reporting. That clearly points to a slower adoption than many in the industry acknowledge.
A major part of the reason for that is an inability to build business messages for newer applications and therefore an inability for techies to get the dollars to purchase the new systems. I talk about that a lot in my blog, wonderful technology that gets only slowly adopted because technical messages don’t interest a business audience.
Then there was the slide titled “Dashboards are the most commonly used kind of analytics.” Dashboards aren’t analytics. Dashboards are a way to display analytics. However, as it takes a technology to create dashboards to hold analytics containers, technical folks think technically and get fuzzy. Many of the newer analytics tools, including many providing predictive analytics, embed the new analytics along with others inside dashboards.
One key slide, that might seem obvious but is very important, is about the areas where next generation analytics are being adopted. The top areas are, in order:
Two of the first three are focused on top line business, revenue, while the other two have to balance top and bottom line. Yes, operations matters and some of those areas aren’t far behind, but the numbers mean something I’ve repeated and will continue to repeat: Techies need to understand the pressures, needs and communications styles of folks they don’t often understand, and must create stories that address those people. If you take anything from the TDWI report, take that.
One pair of subjects in the talk made me shake my head.
First, the top three groups of people using advanced analytics in companies:
We can see the weight of need overbalanced to business categories, not the mystically names and overpriced data scientist.
The report has a very good summary of how respondents are trying to overcome the challenges of adopting the new BI solutions (page 22, worth downloading the report). Gaining skills is the first part of that and some folks claim their way of doing it is to “Hir[e] fewer but more skilled personnel such as data analysts and data scientists.” Those are probably the folks in the middle bullet above, who think that a priesthood can solve the problem rather than the most likely solution of providing skills and education to the folks who need to use the information.
Fern Halper was very clear about that, even though she’s a data scientist. She pointed out that while executives don’t need to learn how to build models they do need to understand what the new models need and how to use them. While I think that dismisses the capabilities of many executives, it does bring the information forward. The business analysts are going to work with management to create real models that address real world problems. Specialist statistical programmers might be needed for very complex issues, but most of those people will be hired by the BI vendors.
Q&A, to be honest, hit on a problem with TDWI webinars. There were a couple of business questions, but the overwhelming number of questions were clearly from students looking for study and career advice. That leads to a question about the demographics of the audience and how TDWI should handle future webinars. If they want the audience to be business people, they need to market it better and focus on business issues. That means from the reports all the way to Q&A. Yes, TDWI is about technologies that can help business, but adoption will remain slow while the focus is on the former and not the later.
The latest TWDI Best Practices Report has some interesting information to describe the slow adoption of advanced BI into the marketplace. It has some great nuggets to help vendors focus better on a business audience and suggest IT needs to also pay more attention to their users, and it’s more balanced than other recent reports. However, the presentation of the information still makes the same mistake as that made by many vendors – it’s not creating the clear, overarching business message needed to speed adoption.
If you missed the presentation, don’t both with watching on-demand. However, download the report, it’s worth the read.