TechTarget has published an article of mine at http://searchbusinessanalytics.techtarget.com/feature/Focus-on-wide-data-not-just-big-data-in-analytics-systems
Wide Data, not just Big Data
Leave a reply
TechTarget has published an article of mine at http://searchbusinessanalytics.techtarget.com/feature/Focus-on-wide-data-not-just-big-data-in-analytics-systems
I’m regularly commenting on how companies are communicating their benefits. One thing I see seems often to be a scatter-shot approach to marketing. Some ideas are semi-formalized and then thrown out to whatever channels are handy. That usually doesn’t work.
You may have heard the term Integrated Marketing. It’s the idea that all your marketing messages should be consistent throughout all your communications channels.
Integrated marketing means more than marketing informally telling different people similar messages. It means formalizing your marketing message, distilling it to the core so that each channel group can work off of the same message to customize it appropriately for each channel. That’s where the positioning document comes in.
The Product Marketing Manager (PMM) is usually the owner for the message for each product, while corporate marketing can have a separate positioning document for the business. As I’m talking about how to better focus on marketing products, I’ll be referring to the PMM. Sadly, there’s not enough understanding of the need for a PMM in many small companies, so that’s one reason the messaging tends not to solidify, but this article will refer to the position.
The market positioning document should be a tool for consistency in all channels. That means it’s an internal tool as long as “internal” also means resellers or any partner who customizes messaging.
A positioning document for enterprise software solutions needs to address the following key issues:
While all the issues matter, it’s the middle one that, like any deli sandwich, is the meet. What you have and what the market wants meets at your value. Part of that value section can be the elevator pitch, but it has to make clear why it is somebody wants to write you a check.
There are a number of ways of creating the positioning documents, so there’s no single template to define. What I’ve seen are two typical directions depending on the size and focus of the company.
Startups and early stage companies are typically focused on their technology. They’ve built something they think is needed and that a couple of prospects, typically known personally by founders, think they want. They need to formalize their market positioning, so they should start with what they have. The ordered list of bullets above area a good flow for companies in the early stage to clarify what they have and then figure out the larger market that can boost sales.
However, mid-size and larger companies should have things turned around. They should have changed from finding a market for cool technology to building technology for a market they understand. That means starting with the target audience. What are their pain points? What about their business needs help. Then look at those and understand where you can add value. From there, adjust your products or create new ones. The positioning document should help define products, rather than describing them.
One critical item that should run throughout the positioning document though not mentioned explicitly is the simple fact that product marketing isn’t in a void. PMMs are part of a larger corporation. Do not create a positioning document within the product marketing group but ensure that messaging matches corporate strategy. While that might sound obvious, I’ve seen examples of different PMMs creating positioning documents that contradict each other because of a product focus that doesn’t take into effect corporate needs.
The PMM controls the product messaging for public relations, advertising, analyst briefings and more. To be involved in all of those tasks to a detailed level is a huge strain upon a busy job. If the positioning document can be for basic boilerplate, it can save the PMM time. Whether the corporate marketing team extracts information to combine with other information, then runs it by the PMM or the PMM uses it as a basis for multiple documents to quickly hand off to the team, everyone’s job is made easier and more effective.
An oft overlooked, use of the document is SEO/SEM. Keywords matter. Trying to sit and think those up in a void is often an experiment in randomness. However, if you can distill what you’re doing into a core value statement, your keywords arise naturally. Depending on the search engine and the campaign, terms for the specific target audience can help raise results, as can understanding competitive positioning. The SEO/SEM team can work with the positioning document test keywords and bring them back to the PMM for analysis and refinement.
Don’t forget channel partners. While smaller partners can directly access your collateral or simply add their logo and contact, larger partners have their own processes, standards and templates. The positioning document can provide consistency across organizations, and even more important task than within your own organization.
A final example for all PMM’s can be summed up on one word: Re-use. The PMM is the source of the product message and has to keep abreast of all the places where your products are mentioned. If you can clarify and distill your message into a single document, you not only help the company but yourself as well. You’re no longer remembering the multiple documents where pieces exist or managing a large folder of examples. You have the document. You can boilerplate lots of information. When you distribute it and the rest of the marketing or sales team calls with questions, you can have them refer to the standard usage and messages, then more quickly help them adjust the messages to any unique environment.
The market positioning document should be a key tool used by every product marketing manager. It will help you focus your product message and then improve the effectiveness of working with others to customize that message for each channel of distribution. Good use of product positioning documents can create powerful messages that repeatedly address the key needs of the market across all channels, providing a consistent front that helps your company show value to prospects.
Found Marketing the Moon: The Selling of the Apollo Lunar Program in the new book section of my library. For tech marketing types, it’s a fun browse about the PR involved at NASA during the Apollo missions. Ignore the mediocre writing and a few missing captions, it’s a cute little time capsule
Logi Analytics visited the BBBT last Friday. The presenters were Brian Brinkman, VP Products, and Charles Caldwell, Principal Solutions Architect. Logi Analytics is another player in the front end, the user interface to provide useful and timely information to the business user.
I’ll start with the demo, though it came last, to begin with what I liked.
Logi Analytics is rightfully proud of their user interface. During the presentation, Brian and Charles mentioned their focus on usability and that the company had UI experts and customers work to drive the creation of the interface. It shows.
It’s not flashy nor is it kludgy. It’s a pretty clear and easy to use interface for starting with tabular views of data and quickly creating graphics to display the information. One little feature I really liked was an intermediary step that really helps users review information. You can have a column after a data column which displays a slider showing where that data fits in relations to the rest of the rows, below or above average.
That and many other features show that business folks used to spreadsheets can begin to look at what they know and more naturally move to modern visualizations.
The one nit I have is that their focus on the front-end means they didn’t really show how their technology supports IT and business analysts behind the scenes so they can support the business users. They’ve done a great job on the interface, but I’m not sure if there’s a lot of meat underneath.
They’ve been around since 2000 and, according to one slide and a brief message, their early focus was on XML to provide information from business systems to web applications. Their October 2013 round of investment doubled their previous total and brought investments to slightly over $50 million. So, for a 14 year old company with that much money and a focus on business users, one question immediately pops up for me when I look at their leadership page, one you’ve heard me ask of other small companies: Where’s marketing? A lot of people to build product and a couple to sell product, but nobody listed at the highest level who is focused on ensuring a match between products, market needs and messages to bridge that.
The lack was demonstrated by the presentation. They performed some surveys, but they don’t know how to bubble up the ideas on clear slides, with the information remaining far to technical and often hard to read. There was one comment about a term when the presenter said “what my marketing people call…” That shows they have some marketing and that they don’t think much of the organization nor is the team in the field willing to use consistent terms as a corporate image and a unified team.
In addition, they make the claim they’re a market leader while, since they’re private, refusing to give any details to substantiate that claim. They did tell us that around 1/3 of their business is OEM, which is very good for a company determined to expand BI into more business areas.
Then there’s getting their message straight. One overbuilt slide showed survey results implying that IT emphasized dashboard building much more than business users cared. Logi Analytics took that as a way to better focus on business user needs but only a few slides later they showed a continuum of self-service analytics they want to provide and three of the five boxes emphasized dashboards.
Back to something being done well. Everyone talks about self-service analytics but there’s no consensus on a definition. Logi Analytics is taking an honest look at the issue.
The best discussion in the presentation was on the continuum mentioned above. They were the BBBT presenters who best provided a definition similar to mine. They point out that self-service is in the analytics, in the data discovery and wandering through data. The background of getting it and the formality of accepted reporting being controlled by central authorities are something IT will always remain strongly involved in providing. It’s the ability to independently surf the information that needs to be enhanced. They’ve made a great start in clearly defining what self-service really is so they can address how that matters to end users rather than slapping a whole lot of information into the tool so business analysts can get into details but knowledge workers get confused.
That also ties into my mention of the nit on the demo section. It’s well and good to provide a great interface for the business knowledge worker. However, they still must be supported by analysts and IT staff. A strong platform and suite will have the ability to provide that. Logi Analytics might, but it wasn’t seen. Make sure you ask.
It’s the usual conundrum for startups. They have the beginnings of a strong product and the founders seem to have a good vision and are on their way to clarifying that vision. However, it’s still the focus of founder->developer->sales without marketing to look at it all, collate what everyone’s doing and build better corporate and product foundations which will help grow. It’s a crowded market and a lot of weeding out will happen within the next three to five years.
Marketing’s job is to combine vision, technical knowledge, and market information to create a holistic view of where the company show go and how to get there. Sadly, too many folks in high tech (and, honestly, elsewhere) think it’s only about pretty graphics and words. While other groups focus on development, sales, OEM relations, support and more, marketing’s needed to be the generalists.
They have a good start, but without more priority on that core marketing task, they’ll be at risk. The chasm approaches and the startup mindset rarely gets companies over it.
Today’s TDWI presentation (And they’ve crammed a number of webinars into this week) was led by Philip Russom, TDWI Research Director, and sponsored by Teradata. While the name of the topic was clearly a push to market their best practices report series, I have to say that this presentation was about both higher and lower level concepts than best practices, not that that’s a bad thing.
The one clear thing was the point made by Philip at the beginning. Given the title, this was a presentation aimed clearly at IT and data management issues. Considering my comments on Teradata’s presentation to the BBBT and about previous TDWI webinars, that’s a comfort zone for both organizations. They don’t understand business users of technology as well as they understand the people creating the infrastructure.
As usual, TDWI bases their discussions on the results of the vast number of very interesting surveys that are the basis of their research. The first set of numbers of interest today was the response to a question on what technical issues are pushing change. The need for analytics edged out data volumes for the top spot. That’s the one clear indication that business users are driving IT spending and should be focused on a bit more closely.
One key point made by Mr. Russom was that one of the key questions asked by knowledge workers to IT is always “Where did this data come from?” Data governance matters, even during the rush to focus on rapid analytics. He came back to the point multiple times in the presentation and it’s important for more people in IT to realize that the techniques and technologies falling in the weird category of Big Data won’t become mainstream until data governance is competently addressed by vendors.
One problem I have with the presentation, and with many of the folks discussing the new types of analytics is they create an artificial wall between reports and analytics. Philip gave an example of fraud protection and how reports would cleanse the data, hiding both the positive and negative connotations of outliers. Well, not quite. Those of us who were programmers years ago, not academics or analysts, clearly remember that exception reporting was always critical.
New analytics techniques allow us to better manipulate the same data in more complex ways or larger data sets faster, but the goal of reporting and analysis is the same: To display information in a fashion that allows actions to be derived from useful information. For some information, a simple report is appropriate, in another a Paretto diagram might be better, but they’re both valuable and there’s nothing new about the intent of modern analytics.
True best practices looks at what’s the appropriate technique for delivering each type of information. Mr. Russom did, a few slides later, talk about older and newer techniques working together as in two decks of cards being shuffled together and I think that imagery is better than his words since the decks look a lot alike.
Another thread that ran through Philip Russom’s presentation was the mention of broader data sources. This is a key point of mine that I’m figuring out how to better document and publish, but I’m not the only one. I’ve always had a problem with the phrase “Big Data.” Big is always relative and constantly changing, plus it’s more of a hardware issue. What’s new about current data management is that the number of sources are much more varied, unstructured data is taking a more prominent role, and IT must look at how best to access very heterogeneous sources and providing integration between them. A Russom points out, IT must be focused on breadth even more than volume.
That led to his final topic, and the perfect lead-in for Teradata, that Hadoop isn’t about to replace EDW’s but that IT needs to figure out how to ensure both co-exist and lend their strengths to cover each other’s weaknesses.
Chris Twogood then took over, focused on technology issues around Hadoop, JSON and other newer tools for managing data. Being a business person, I found the most interesting thing in Chris’ presentation to be a fly-by slide on the way to technology. Teradata defines the goal of data driven business as to “Achieve sustainable competitive advantage by leveraging insights from data to deliver greater value to their customers.” The only thing I’d do is shorten it, ending at “value.” After all, the customers aren’t the only stakeholders in a business. Better insight means better financial performance that can benefit owners and employees alike.
The presentation quickly moved along to Chris discuss the breadth of data means Teradata is working to provide access to all those sources. Teradata QueryGrid™ is their solution to provide an interface across data sources. Though I’m sure they’ll hate me for saying it, think of the product as ODBC on steroids.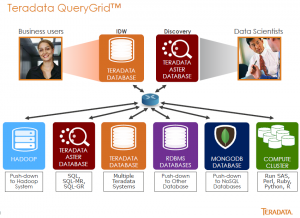
From discussing that, Mr. Twogood then made a transition to making a claim that somehow the solution means they’re creating the “disruptive data warehouse.” I know that so many people in leading edge fields want to think they’re invention something glorious and new, but it just isn’t. This is an evolutionary change and not even a big one at that. What Teradata describes as disruptive is just the same concept as defined by the federated data warehouse concept discussed since the 1990s. Technology is finally advancing to be able to provide the actuality impossible to provide back then, but it’s just normal growth. That doesn’t make it any less powerful.
To emphasize that, one question during Q&A gave Philip Russom a great opportunity reinforce a few points by referring again, to data governance. He pointed out that the issues of data governance are the same for the EDW and Big Data. He also extended that by saying that good data management means you’re always trolling for new data sources. Big data isn’t the end, it’s just a part of the continuum and where we are now.
Yellowfin held their 7.1 global release Webinars on Wednesday and I listened to the first. The presenters were Glen Rabie, CEO, and Daniel Shaw-Dennis, GM for EMEA.
The key point I took from it was their clear understanding that self-service isn’t the end-all of BI. One early slide pointed out they are concerned with making “A find balance between the needs of self-service users and enterprise IT.” All of us want to allow knowledge workers to more easily understand their business, but data must have some centralized control to security, consistency and validity requirements. It’s nice to hear vendors, and Yellowfin isn’t the only one, begin moving away from the extreme self-service message.
Another critical point is their claim that only 10% of their users want to create data and the other 90% want to consume. They pointed out that they want to focus on the 10%, providing tools that allow for faster and easier creation. Given their demonstration, I believe them. I don’t think the 90% is going to easily get up to speed, but the power for the 10% is very good. The only question is how sustainable that model is.
One way they’re making it easier to create is by extending the power of auto-charting. Vendors are also realizing the business users start with their data and many applications demand they pick graphics (histograms, line graphs, etc) both too early and to people who might not be clear about which is the best chart to use. Yellowfin is helping users by using under-the-hood analysis to suggest default display methods while still allowing the method to be easily changed. That’s a great way to speed visualization and understanding of the data.
Another key YellowFin 7.1 enhancement area has to do with Glen’s statement that 80% of all business data has a location component. Yellowfin is adding a much stronger geospatial package. They are creating what they call Geo-Packs to provide customers with information that helps with geospatial customer, logistical and other analysis. While the package is in the infancy and, as usual with companies focused on the large US market, aren’t strongly fleshed except for the US, it’s a great start and it looks like the company has built in a way to easily expand.
Finally, they announced a marketplace to share reports between customers but, to be honest, who hasn’t? It’s rapidly becoming standard functionality in the marketplace, a “me to!” It’s good they’re adding that but, so far, I’ve mainly seen companies putting out their own reports for customer consumption. I haven’t seen the market mature enough yet for major sharing between customers. It’s needed, but still early to be of full value.
Yellowfin 7.1 continues to focus on helping power users create analytics for consumption by business knowledge workers. The focus on balancing self-service with the needs of data governance is very good while the growth of geospatial analysis has a strong start.
Their messages and products seem to be working together to continue to give them a good presence and strong growth potential in the marketplace.
Datameer showed up at the BBBT last Friday and it was interesting. The presenters were Stefan Groschupf, CEO, and Azita Martin, CMO. Stefan worked on Nutch project out of which Hadoop was born and he had a refreshingly non-open standard addicted viewpoint of the industry. He very clearly pointed out that Hadoop was big, slow and great for analyzing gathered information but not for speed. He also pointed out that RDBMS’s aren’t going anywhere. The most accurate and humorous thing I’ve heard for a while in a presentation is “hadumping,” Groschupf’s term for getting information into Hadoop.
On the UI front, they’ve picked and stuck with a very spreadsheet oriented view of the data, pointing out that’s what everyone knows so it’s easier to leverage the technology into companies and departments who have been using spreadsheets for years. Yet later he knocked SQL with Hadoop without realizing that’s the same thing. Even worse, he’d already pointed out just how expensive Hadoop programmers are to hire and seemed to miss that hire a few of them and then more affordable SQL workers, of whom there are many more than Hadoop experts, for the high level analytics might make sense.
Meanwhile, while the spreadsheets are familiar, modern BI is providing graphics. The interface they showed is very simplistic and needs work. While the individual graphics weren’t impressive, I did like that they provide a much more naturally looking dashboard paradigm that doesn’t lock in images and allows people to visualize context far more. That was showed in the demo and I didn’t get a good screen shot, but it’s a nice differentiator.
The slide that most impressed me, coming from a small company, was in Azita Martin’s section and presented the customer journey from Datameer’s perspective.
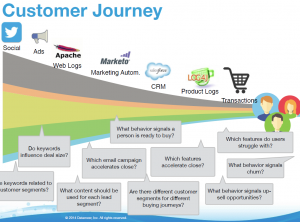
Datameer – Customer Journey
It shows that management is thinking about the customer not just “how do I find somebody to fit the cool thing I’ve built?” They’re a small company thinking strategically. The question is: How strategically?
Stefan Groschupf mentioned Moore’s Chasm and that the industry is moving across it. However, given his admission of Hadoop’s message, I’m not sure that he has enough of a market for it to do the same.
Datameer is focused on analyzing large data sets to find relationships for things that have happened. You might get predictive information out of it. In fact, you hope to do so. However, this is not real-time analytics and isn’t meant to be. I think they have a good product for what they’re marketing. However, as big as that market is, it’s a niche. The growth in BI is moving towards meshing backwards looking, historical data with real-time information (regardless of the wide differences in the meaning of that word within difference industries and user parameters) and providing predictive analytics that can impact decisions that have immediate impact.
While BI is crossing the chasm, I think that analyzing large datasets will have a product life cycle and not a market life cycle. People will continue to want it but they’ll want it as part of a larger solution.
For instance, they briefly talked about enhancing operational analytics but much of what that market is doing, whether in hospitals, the transportation industry, oil fields or elsewhere is demanding faster analytics to find problems before they happen and take proactive actions. Slower analytics will help, but as a subset.
So what’s that mean for Datameer?
Datameer management has a great understanding of Hadoop’s strengths and weaknesses and they’ve done a good job of focusing on the strengths to create a company with a great short term future. Looking at the larger market, however, makes me think of two words: Acquisition bait.
Many founders think that success is only in terms of making it to IPO. Many others, thankfully, have a more open view to other exit strategies. Acquisition is nothing to be ashamed of and another great sign of success. If Datameer keeps focusing on their niche they’re going to build a strong customer base with a good technology that will fit somebody’s needs for enhancing an overall BI portfolio. There’s nothing wrong with that.
If you’re looking for a company to help you better understand large and diverse datasets, you should be talking with Datameer.
Last Friday’s BBBT presentation was by Cisco Composite. Composite Software was a company in the data virtualization space until it was bought by Cisco last year. The initial problem is what is it now? My internet search bubbles up two pages:
The presenters assumed folks at the BBBT knew who they were because of a previous presentation, but the group’s grown a lot in the last year. The people should have started with a basic overview of product and company. Bob Eve gave an introduction, but it was very brief and made too many assumptions. Composite was in the business of providing access to disparate data sources in a way that allowed business applications to leverage that data into information and then insight. Think of them as ETL without the L. So why did Cisco buy them?
The confusion was slowly cleared up over the course of the presentation and Q&A. The data visualization tool is being incorporated into Cisco to help create a full solution offering for the Internet of Things (IOT). Mike Flannagan, General Manager, Data and Analytics Business Group, showed a good slide that I think is too crowded to really show in the blog format, but provided three different layers for Cisco’s strategy for delivering enterprise solutions. From bottom to top, they are: Ready to build, ready to integrate and ready to consume. From network management components at the bottom to solution sets such as Connected City at the high level, it’s a well thought out approach for a major organization to provide flexibility and control across markets.
Mr. Flannagan’s key point is that that IOT means the amount of data flowing through networks has massively increased and will continue to do so, and that edge devices, the network and the applications they support all have to adapt to meet the changing environment. While that might be obvious, there’s an old saying that common sense isn’t. It’s good to see the Cisco is looking at the full range from edge to application, and not just concentrating on the network.
Jim Green, former CEO of Composite and now CTO, Data and Analytics Business Group, Cisco, gave an NDA presentation. I can’t wait until some of it is announced because a key part is very interesting, so I’ll talk about it at some point – just not today.
Kevin Ott, General Manager, Data Virtualization Business Unit, focused on the massive amounts of data sources that have to be comingled in an intelligent fashion. He has one of the best graphics I’ve seen to show that, displaying just some of the no-SQL technologies in the market today.
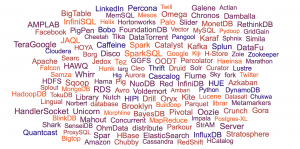
Some no-SQL options…
However, then he brought up something that made my marketing mind shudder. Kevin rightfully pointed out that there are lots of clouds, not just the Cloud that’s marketing. Individual sets of servers inside and outside corporate firewalls. He posited that some term in needed to refer to the entire set of networked things and came up with Intercloud. What?!?!? We have had this thing called the internet for quite a while now. Back when we old client server folks were drawing clouds to represent the internet while designing systems, we knew that the cloud referred to the internet. There’s no need for a new term. I know many in marketing love to invent words, but there’s just no need in this case.
The network is a key component in today’s information infrastructure. The explosion of Cloud applications combined with the supernova of edge device growth in the Internet of Things means that a networking company must adapt if it is to help the industry and itself. While the key component of Cisco’s plan to do so is not something I can yet discuss, and while the presentation was a bit disjointed and some concepts still need clarification, I can state that it seems as if Cisco knows what it’s doing in this arena.
Their own problem seems to be they don’t yet have their message together and coherent. Hopefully that will be fixed in the near future, and I’ll watch it carefully. The right mindset and solution are necessary, but not sufficient. They need to communicate better.
Cisco Composite is on the right path to helping Cisco build a strong and holistic set of offerings to help us manage the information explosion across the internet, from edge devices to the BI applications for the business knowledge workers.
Today’s TDWI webinar was a good one. Fern Halper is one of the few analyst who managed to speak to the points that are relevant to the sponsor, so that the full presentation works. Today was no different. Today’s sponsor presenter was Allen Bonde, VP, Product Marketing and Innovation, Actuate, and they made a good team.
The presentation was a good overview of the basics of predictive analytics. It started with an overly complex but accurate description by Fern as predictive analytics being “A statistical or data mining solution consisting of algorithms and techniques that can be used on both structured and unstructured data to determine outcomes.” Data mining is an overused term that still manages to be too limiting, it doesn’t belong there. Neither does the description of different types of data as some predictive analytics, such as in operations, don’t necessarily need unstructured data. I’d just say it’s the analysis required to increase the ability to better understand the likelihood of near term outcomes.
What I really liked about both presenters is that they tended to use customer facing examples from sales, marketing and customer support to discuss predictive analytics. Too often, the focus is on operations, either at a detailed process level or a very high business review at the CxO level. The fact that there are many more applications that impact a larger body of business users is good for the market to see.
One thing that I think Ms. Halper didn’t quite think through was how decision trees, her favorite tool (at least as per this presentation) for predictive analytics. While she did briefly mention that there’s overlap between predictive analytics and other types of analysis, I’m not in agreement that trees fit the description – especially as her main example was customer support. In that arena, and others such as financial approvals, decision trees have long been used for call scripts and process flow. They aren’t used to make predictions but to help the service folks make decisions regardless of the outcome at each step. I’d like to hear more about how she thinks they tie into the other predictive tools she mentioned.
Another key point Fran made was how the new technology means that the tools are available closer to the actual business knowledge worker, with applications becoming useable by business analysts, not just statisticians. The numbers from TDWI Best Practices Report Predictive Analytics for Business Advantage, 2014 were interesting.
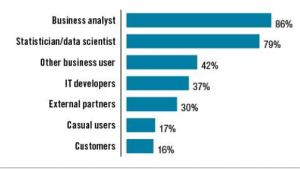
TDWI Best Practices Report Predictive Analytics for Business Advantage, 2014
It was humorous, but no surprise, that the first question in Q&A was from somebody who probably defines him or herself as a “data scientist.” There was umbrage at mere business people being able to work with predictive analytics packages. Halper tried to allay the fears that the money spent on an MS might become useless by pointing out that detailed math is needed to create the processes and some understanding of the analytics is still needed to intelligently use the results of the analysis.
Still, I expect the numbers for analysts and “other business users” to grow in the near future while the statistician is more properly used to build the algorithms and think of new tools that can then be provided to the knowledge worker through modern tools.
Allen Bonde’s section of the presentation, unlike others who have been too technical or salesy, was too high level and didn’t differentiate enough from Fran Halper’s. While we want to see companies positioning themselves as thought leaders push concepts, they are the sponsor and need to tie the thoughts back to their business.
Let’s start with Actuate’s tagline: The BIRT company. What’s BIRT? A bleeding edge audience will know, but TDWI has a wide audience of knowledge in its audience, from open source to large enterprise, still almost exclusively proprietary software shops. He needed to give just a couple of sentences but he didn’t.
The Business Intelligence Reporting Tools (BIRT) project is an attempt to create an open source BI interface. It was started by Actuate who turned it over to a foundation to drive open development. As usual, for most of us, refer to the appropriate Wikipedia article for a brief overview.
His main point was, as he put it, “Fast is the new big.” Though the concept isn’t new and is rather just a return from the focus on misnamed Big Data to how to take whatever data we have, regardless of size, and shorten the time to analyze and provide that information to decision makers. Most of the rest of what he said also wasn’t new to people who have been in the BI industry for a while, but it was at a good level to reinforce Halper’s point to an audience who is just getting familiar with the state of the market.
Fran Halper and Allen Bonde gave a good, high level overview of some of the key points about predictive analytics. I had nits with some issue and think that a little more meat might help, but I suggest going to TDWI to view the webinar if you are someone who wants to know the basic issues needed to start using predictive analytics as part of a robust BI solution to help business make better decisions.
@fhalper, @abonde, @tdwi, @actuate
The problems with the USA’s Veterans Administration are in the news. Much of the scheduling issues have to do with large volumes of modern data being run through decades old systems built by systems integrators (SI). Custom built systems can be the choice during the early stages of a software solution category’s life cycle. However, they are very difficult to upgrade and modernize.
Last Friday’s BBBT presentation was by Salient Management Company. Salient is a consulting group with a product and all the potential hazards of SI’s came to mind. The presenters, David F. Gianneto and Jim McDermott, are both in professional services. The obvious question was how much of their solution is customized versus how much is truly a software solution that provides the ability to upgrade and adapt as needs change.
Modern business software is complex. Every software firm must have professional services, either internally or through partners, to help with implementation. Many software founders think their software is so wonderful that they don’t need serious professional services. Many professional services companies think every client is so different that software must always be heavily customized. How do technology executives balance the difference issues of ISV software development and the need for consulting? More importantly, for this article, how does Salient management look at that?
From the cursory experience of a three hour presentation, the balance is a strength of Salient. One slide, in particular, pointed to a logical split. They point that the business user is not the person who has to understand the technology. That’s something everyone agrees is true, but not many companies seem to understand how to address.
David Giannetto and Jim McDermott presented a company that claims to focus consulting at ensuring an understanding of the client’s business model, helping to ensure that the implementation does address business needs, while demonstrating a product that looks like a standard interface.
While that was the focus of the talk, the product demo implied other consulting. They did not cover the complexity of ETL, even though questioned, so I’m also assuming there is significant technical professional services needed to link to data sources. That assumption is backed up by the fact that Salient uses a proprietary database that wasn’t discussed in detail.
One critical point about their technology insight is that Salient began with an in-memory architecture thirty years ago. It was a risky choice as most companies thought that the price/performance ratio benefits of disk would grow far more than RAM. The drop in RAM prices and the growth of parallel computing software are providing strong backing for their initial gamble. They have a clear focus on technology and products.
Their offering seems to be a sandwich of services to understand the business and implement the data acquisition on the outside with robust software for the BI users at the heart. I can see a continued strength in the business consulting, but the robustness of some newer vendors as far as simplifying the back end, and thereby lowering those costs and shortening implementation times, is a potential risk to the Salient model.
Jim’s demo showed both dashboards that allow management to slice & dice basics themselves and a designing interface with more capabilities for power users and analysts. While they claim that the software changes the roll of IT from control to governance, I still didn’t see anything that allows the end users to integrate new sources. IT is still required for more than just governance.
There was also a very good example of how geospatial information is being integrated into the analysis to better understand demographics and logistics. In the CPG market, that can provide a crucial advantage.
One key point that some competitors might knock is that most of the charts and graphs aren’t as fancy as in some BI tools. However, my response is “so what?” First, they accomplish the same things. Second, focusing on how fancy graphs look sometimes creates overly complex displays that can slow understanding. When we’re dealing with executives who have worked with Microsoft Excel or with Crystal Reports for decades, a way of seeing new analytics clearly and simply, almost in the style they’ve seen can help adoption. The focus is on understanding the information and I thought the simpler graphics had the benefit of a comfort level for managers.
Overall, I was impressed by Salient. The combination of strong business consulting, a good BI interface and a history in in-memory data management means that they’re well positioned to address Global 1000 firms. Any large organization should evaluate the Salient offering for the combination of product and services.
The risk I see is that the service/software balance is right for large companies, I don’t see them getting into the SMB market anytime soon. While that might not concern them in the short term, one word: Salesforce.com. There are new vendors coming up which are much easier to implement. If they can grab a large chunk of the SMB market, they can then move up the food chain to challenge the large companies, as Salesforce has done in their markets.
I see Salient growing, I’m just not sure if they’ll be able to grow as fast as the market is growing. Depending on their plans, that could be good or bad.